Basin Discharge Data
- Page status
- Working page
- Updated
- 2026-05-13
Summary
Consolidated discharge data for Nepal's major river basins. Public sources reference these numbers; provenance varies.
Key Figure
Average Annual Discharge at Nepal-India Border
| Basin | Area in Nepal (km²) | Avg Discharge (m³/s) | Annual Volume (BCM) | Monsoon Share (%) | Peak-to-Dry Ratio | Primary Source |
|---|---|---|---|---|---|---|
| Koshi Basin | 27,818 | 1,827 | ~57.6 | 67–78% | 25–50:1 | WECS River Basin Plans and Hydropower Development Master Plan (2024) |
| Gandaki Basin | 32,148 | 1,952 | ~61.6 | 74–80% | 22–30:1 | WECS River Basin Plans and Hydropower Development Master Plan (2024) |
| Karnali Basin | 43,153 | 1,256 | ~39.6 | 65–72% | 15–20:1 | WECS River Basin Plans and Hydropower Development Master Plan (2024) |
| Mahakali Basin | — | ~600 | — | ~73% | — | WECS River Basin Plans and Hydropower Development Master Plan (2024) |
Measurement Scope
These basin numbers need a scope label every time they are reused:
| Measurement frame | Example figure | Meaning |
|---|---|---|
| WECS border model | Koshi 1,827 m3/s | Basin-scale modeled discharge at/near the Nepal-India border |
| Gauge / older NWP baseline | Koshi ~1,409 m3/s at Chatara | Station-specific gauged mean at an internal measurement point |
Both can be valid at once. The conflict only appears when the measurement point is omitted.
Coverage / Method
- WECS river basin plan 2024: MIKE SHE / MIKE Hydro Basin model-derived discharge at Nepal-India border for major basins. Includes climate-adjusted hydrology and sediment-transport coupling.
- National Water Plan: Older gauge-based baseline with different measurement points and methodologies.
- Peak-to-dry ratios: Basin-scale approximations derived from modeled monthly hydrographs. Individual tributaries and gauge stations may show different ratios.
National Aggregate
- Total average annual runoff: ~225 BCM (National Water Plan estimate)
- Only ~15 BCM had been utilized for economic and social purposes in the National Water Plan framing
- 75%+ of river flow occurs in the wet season (June–September)
Dry-Season Stability by River Type
| Type | Dry-Season Stability Ratio | Examples |
|---|---|---|
| Glacier-fed | 0.30–0.50 of mean flow | Upper Karnali, Arun |
| Mixed | 0.15–0.30 of mean flow | Trishuli, Marsyangdi |
| Rain-fed | 0.05–0.15 of mean flow | Bagmati, Kamala, Rapti |
Caveats
- Discharge figures are model-derived; gauge-based records may differ by basin and measurement point.
- Peak-to-dry ratios are basin-scale approximations; individual tributaries may vary.
- Monsoon share percentages reflect long-term averages; inter-annual variability (ENSO, IOD) can shift these bands.
- The Karnali basin has the best dry-season stability but also the most remote infrastructure, so hydrological advantage does not translate directly to buildable projects.
Linked Data
- nepal_basin_seasonality_baseline.csv — merged 9-basin seasonality table with basin type, seasonal splits, source notes, and caution flags.
- The merged table adds medium-basin comparators that make the seasonality argument harder to flatten:
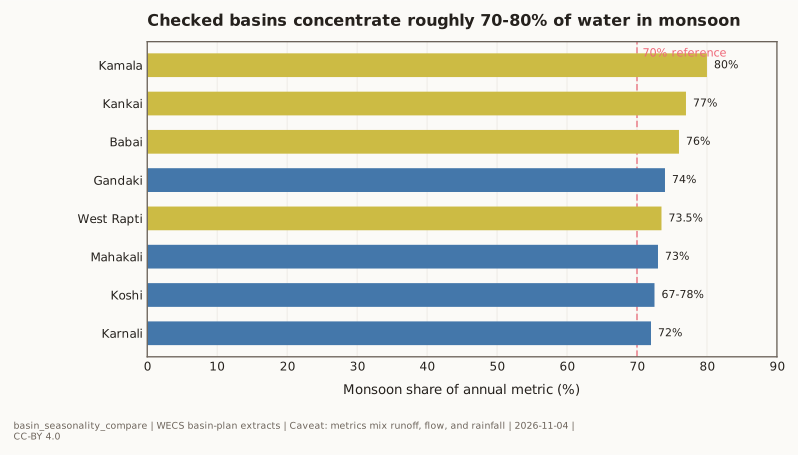
- West Rapti: 73.5% of runoff in four monsoon months, yet still a dry-season deficit basin.
- Babai: explicitly rain-fed, with 76% of runoff concentrated in monsoon months.
- Mahakali: 73% of surface runoff in Jun-Sep despite its snow-fed border-river character.
- Merged tributary notes also add a useful corrective case from the Tamakoshi basin: roughly 62% rain runoff, 20% baseflow, 5% snowmelt, and 13% glacier melt. That is why "high mountain" should not be used as shorthand for "glacier-dominated."
Linked Figures
- basin_seasonality_compare.svg — canonical basin monsoon-concentration comparison.
- wecs_basin_potential.svg — basin-weighted potential graphic; useful as the geographic companion to this discharge table.

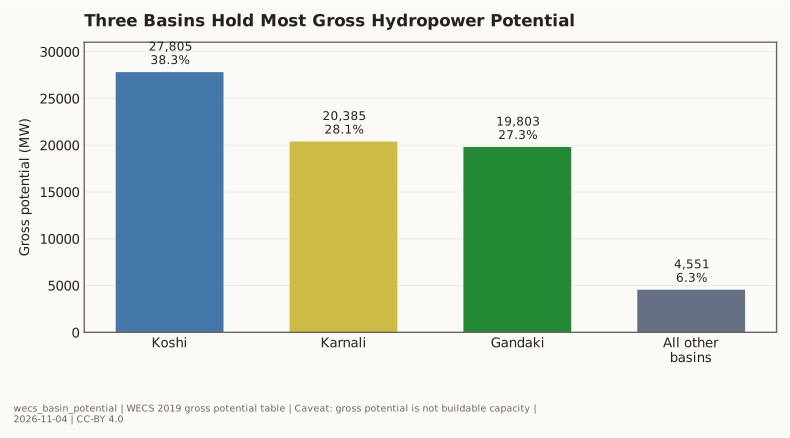
Chart Specification
The current inline figure compares checked monsoon-concentration metrics across basins. A useful next visualization would overlay monthly flow profiles for all four major basins plus one medium-basin comparator on a single 12-month chart, with the monsoon window shaded. That would make Seasonal Mismatch visible as a shape, not only a percentage.