Figure Index
- Page status
- Registry record
- Updated
- 2026-11-04
Summary
Registry of published wiki figures generated from wiki/explorer/shared/wiki-figure-manifest.json.
Published Figures
| Figure | Format | Target Pages | Sources | Caveat |
|---|---|---|---|---|
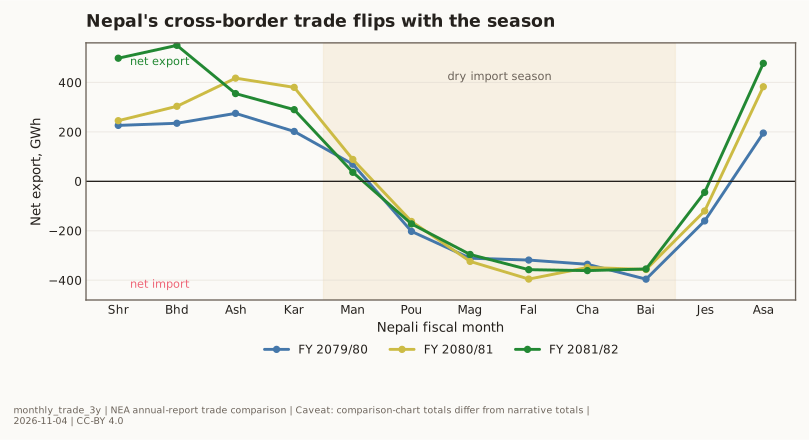
| monthly_trade_3y | SVG | Electricity Trade Time Series | NEA Annual Report FY 2024/25 | Annual-report comparison chart totals differ slightly from NEA narrative totals. |
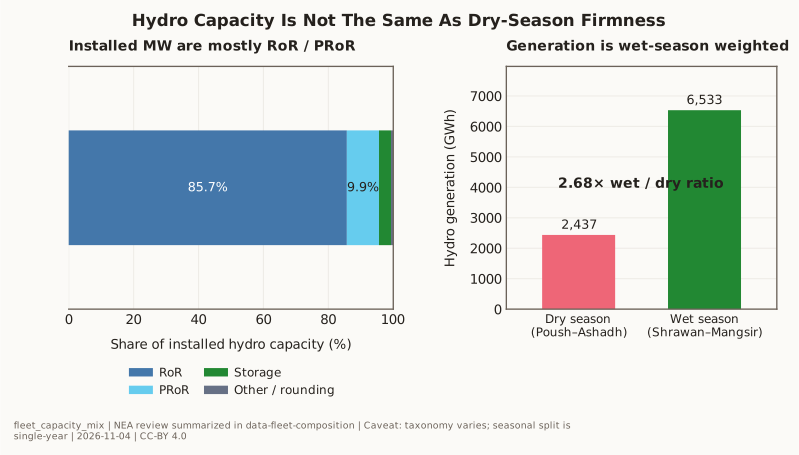
| fleet_capacity_mix | SVG | Hydropower Fleet Composition | NEA Annual Report FY 2024/25, WECS Energy Sector Synopsis Report 2024 | Fleet taxonomy varies by reporting source; FY 2022/23 seasonal split is single-year. |
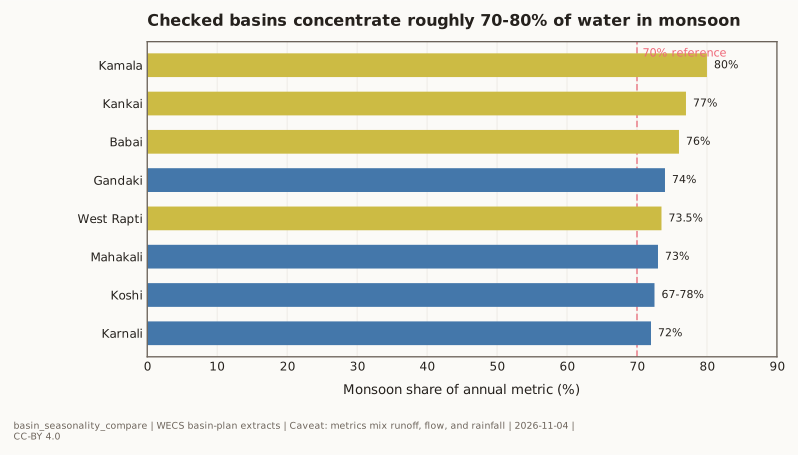
| basin_seasonality_compare | SVG | Basin Discharge Data | WECS River Basin Plans and Hydropower Development Master Plan (2024), National Water Plan, Nepal | Metrics mix runoff, surface flow, and rainfall depending on available public source. |
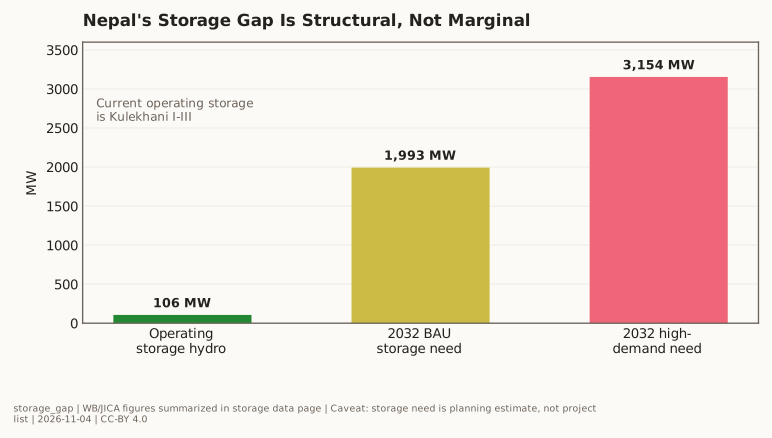
| storage_gap | SVG | Storage Capacity Comparison | World Bank Nepal Water Sector Diagnostic, JICA IPSDP Final Report Annexes (Vol. 2) | JICA storage-need estimates are electricity-system planning needs; current storage uses Kulekhani operational capacity. |
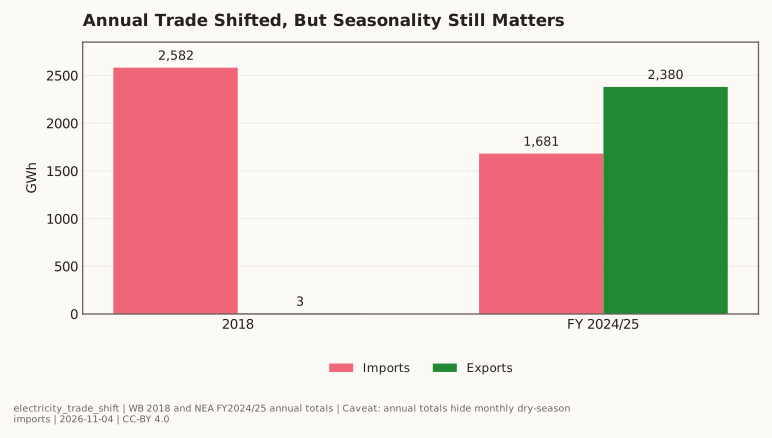
| electricity_trade_shift | SVG | Electricity Trade Time Series | World Bank Nepal Country Economic Memorandum (2025), NEA Annual Report FY 2024/25 | Annual totals hide the wet-export and dry-import monthly structure shown in monthly_trade_3y. |
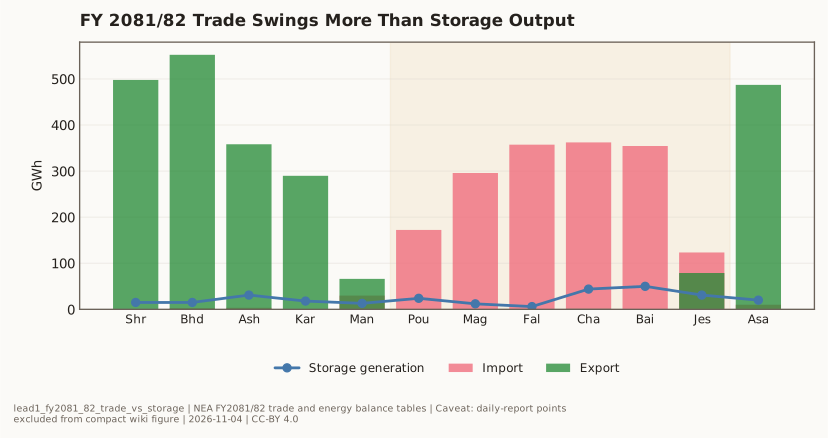
| lead1_fy2081_82_trade_vs_storage | SVG | Electricity Trade Time Series | NEA Annual Report FY 2024/25 | Compact wiki figure excludes daily-report parsed points; see the lead-1 table for daily subset coverage. |
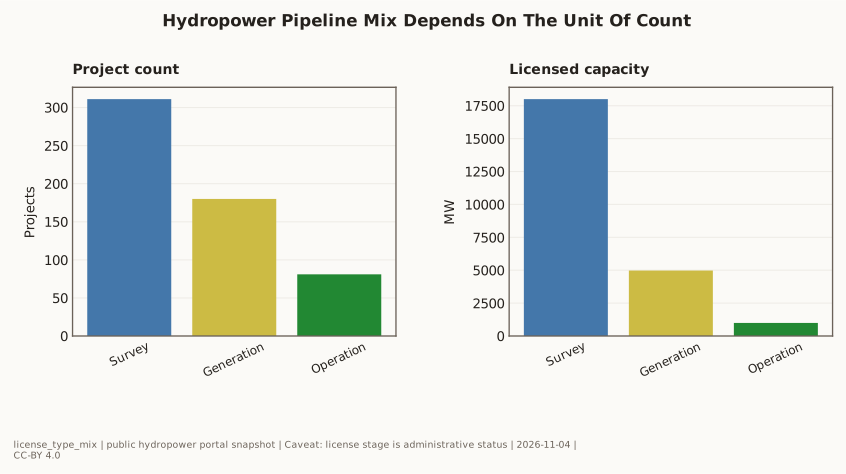
| license_type_mix | SVG | Hydropower Fleet Composition | DoED Licensing Directive 2075 — Hydropower Project Licensing | Licensing-stage counts are administrative status snapshots, not financing readiness. |
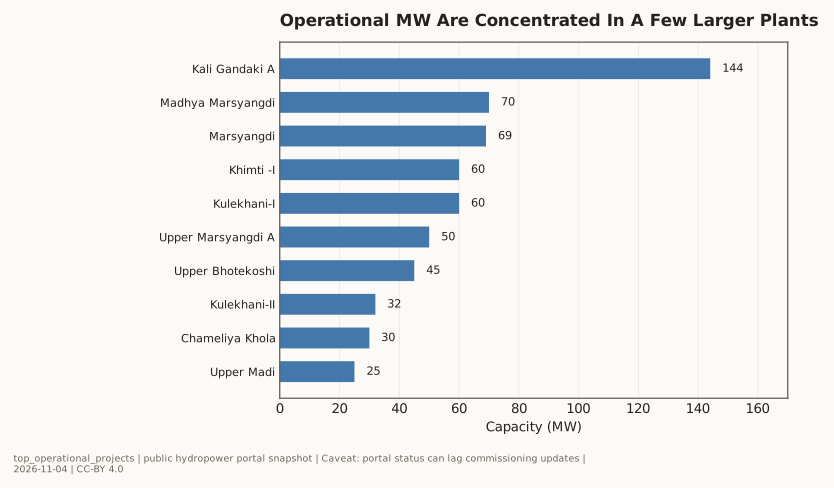
| top_operational_projects | SVG | Hydropower Fleet Composition | DoED Licensing Directive 2075 — Hydropower Project Licensing | Public-portal operating status and capacity values can lag commissioning updates. |
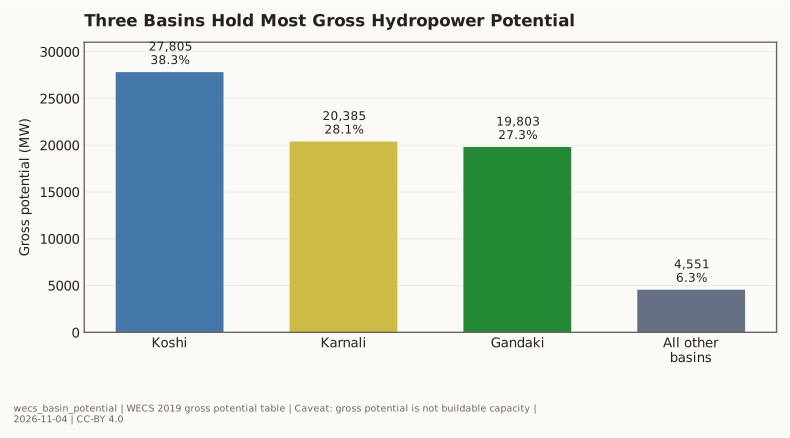
| wecs_basin_potential | SVG | Basin Discharge Data, Hydropower Potential Pyramid | WECS Assessment of Hydropower Potential of Nepal (2019) | Gross potential is not equivalent to economically developable or transmission-ready capacity. |
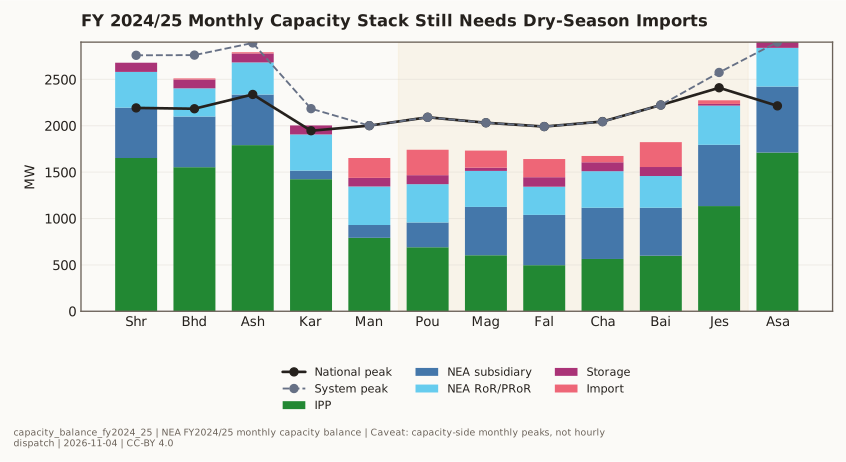
| capacity_balance_fy2024_25 | SVG | Domestic Electricity Demand Distribution, Hydropower Fleet Composition | NEA Annual Report FY 2024/25 | Monthly capacity-balance rows do not replace hourly dispatch or adequacy modeling. |
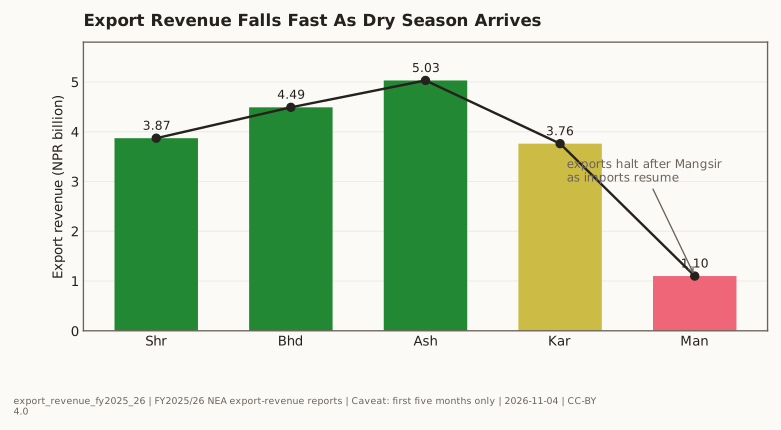
| export_revenue_fy2025_26 | SVG | Electricity Trade Time Series | NEA Annual Report FY 2024/25 | First five months only; this is not a full-year revenue curve. |
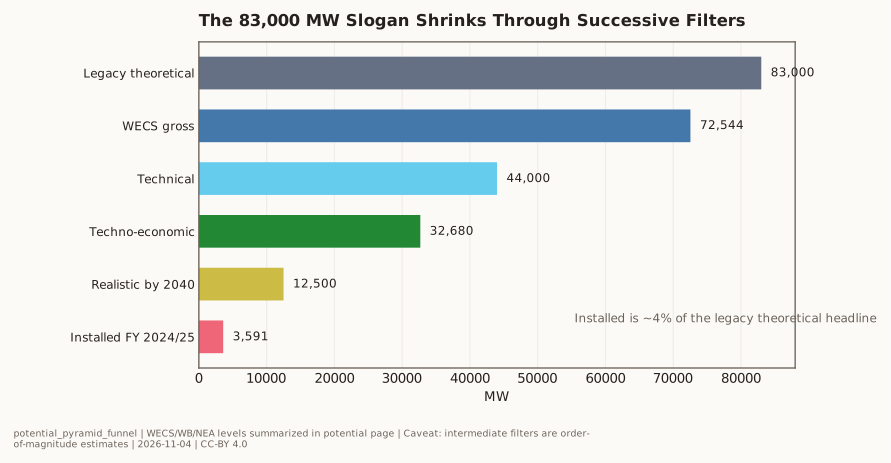
| potential_pyramid_funnel | SVG | Hydropower Potential Pyramid | WECS Assessment of Hydropower Potential of Nepal (2019), World Bank Nepal Power-Sector Evidence Record (2018–2025), NEA Annual Report FY 2024/25 | Intermediate levels are compiled order-of-magnitude estimates, not definitive ceilings. |
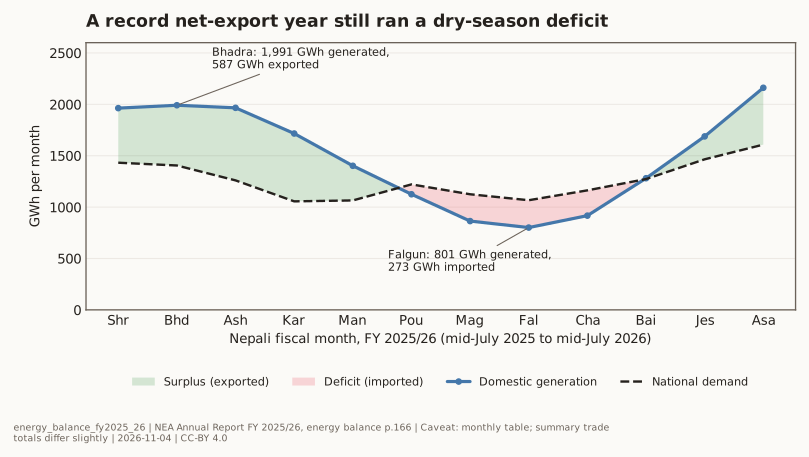
| energy_balance_fy2025_26 | SVG | Master Thesis, Seasonal Mismatch | NEA Annual Report FY 2025/26 | Monthly energy-balance table totals (exports 3,938 GWh, imports 1,155 GWh) differ slightly from the managing director's summary (3,965 and 1,171 GWh). |
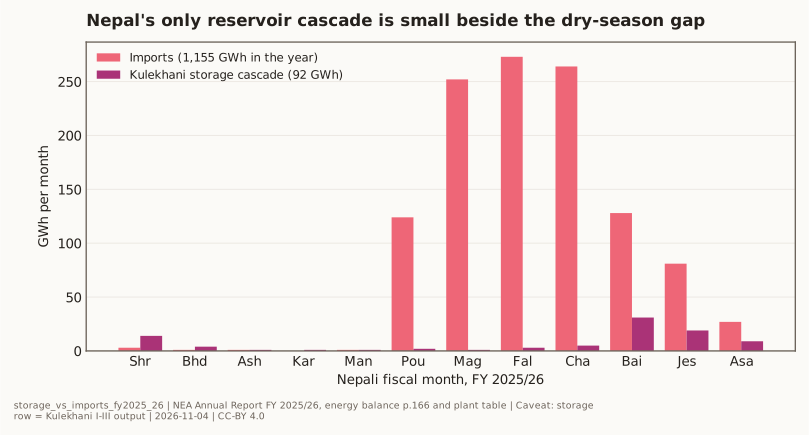
| storage_vs_imports_fy2025_26 | SVG | Storage Deficit | NEA Annual Report FY 2025/26 | The energy-balance STORAGE row equals the Kulekhani I-III plant totals (53.0, 26.4 and 12.9 GWh) in NEA's generation table. |
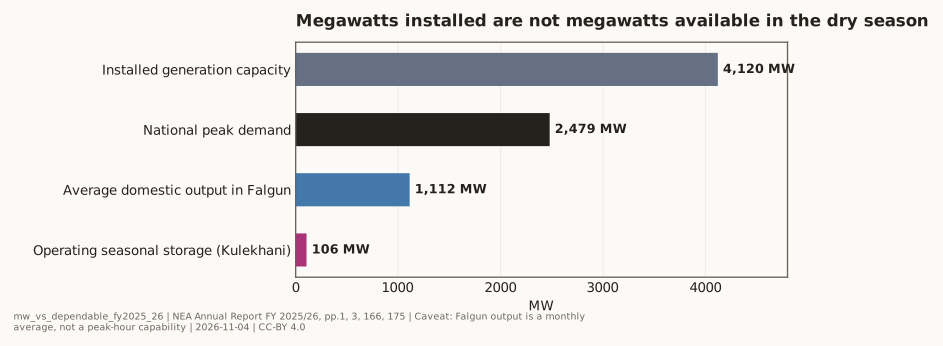
| mw_vs_dependable_fy2025_26 | SVG | Master Thesis, Installed MW, Energy, Seasonality, and Firm Power Are Routinely Conflated | NEA Annual Report FY 2025/26 | The Falgun figure divides 801 GWh by the hours in a 30-day month. It is an average, not dependable peak-hour capacity, which is not published. |
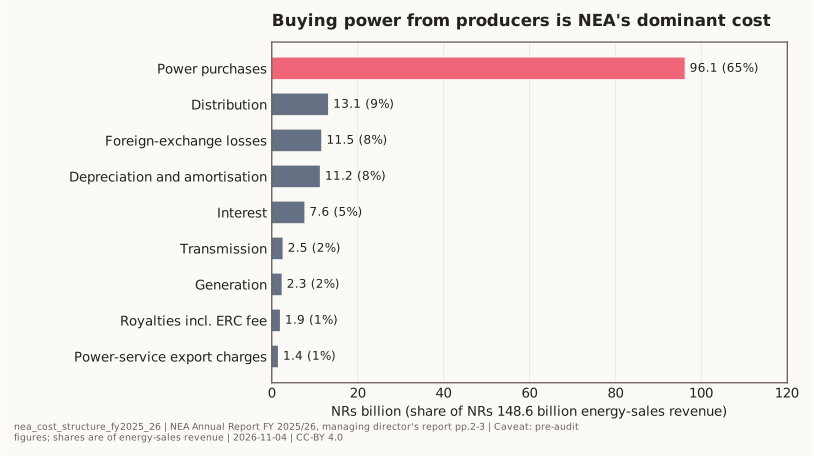
| nea_cost_structure_fy2025_26 | SVG | NEA Triple-Authority Conflict | NEA Annual Report FY 2025/26 | Managing director's report figures, pre-audit. Cost lines are not exhaustive and do not sum to revenue minus profit because other income and provisions are excluded. |
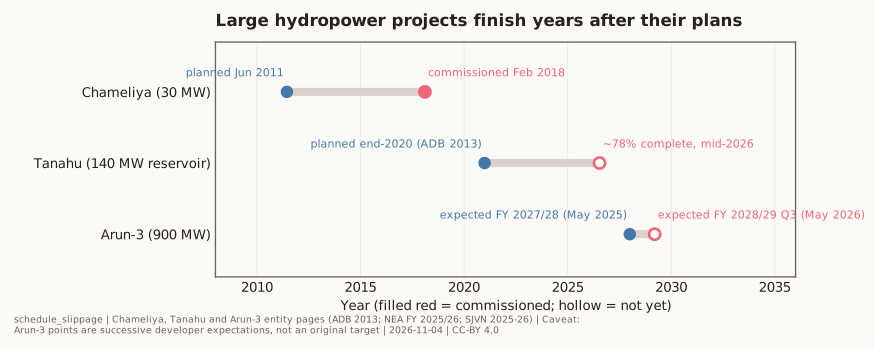
| schedule_slippage | SVG | Buildability | ADB Tanahu Hydropower Project Documents (2026), NEA Annual Report FY 2025/26 | Arun-3's two points are successive developer expectations, not the original target. Mid-year positions are approximate. |
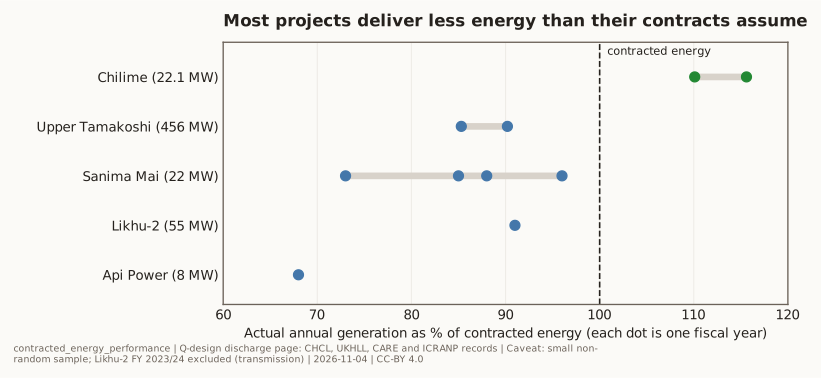
| contracted_energy_performance | SVG | Q-Design Discharge | Chilime Hydropower Company Limited Annual Report FY 2078/79, CARE Ratings Nepal — Sanima Mai Hydropower Credit Assessments, UKHLL Annual Reports — Upper Tamakoshi Hydropower Limited | A small, non-random sample from company reports and ratings; no central public database tracks generation against contract. Likhu-2's FY 2023/24 shortfall reflected a substation bottleneck and is excluded. |
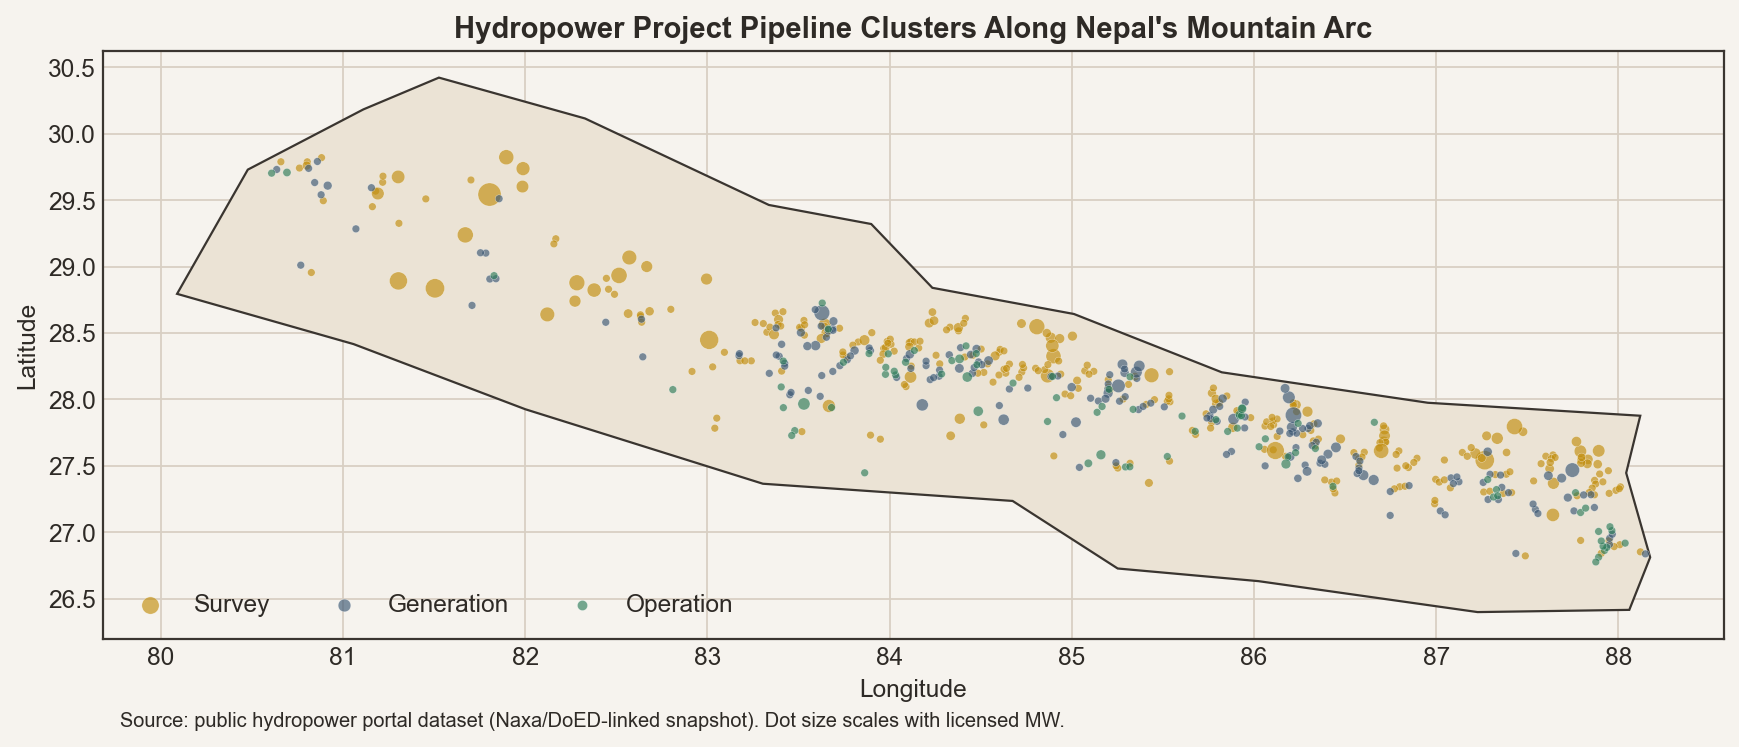
| hydropower_license_map | PNG | Hydropower Potential Pyramid | DoED Licensing Directive 2075 — Hydropower Project Licensing | Static map is a portfolio snapshot; use the explorer map for current interactive filtering. |
Regeneration
Run from the workspace root:
make wiki-figures
The generated manifest is the source of truth for figure paths, source files, target pages, caveats, and license metadata.