Nepal Peak Load Curve FY 2024/25
- Page status
- Working page
- Updated
- 2026-05-12
Summary
The NEA annual report for FY 2024/25 publishes the integrated Nepal power system's annual system peak-load curve and a representative daily load curve for the FY's peak day (27 Jestha 2082 / 10 June 2025). Together they are the canonical reference shape for Nepal's seasonal and intraday demand profile for the year.
Coverage / Method
- Data source: NEA Annual Report FY 2024/25, System Operation Department — published peak-load curve and daily load curve for peak day.
- Method: Chart images extracted from NEA annual report PDF via image atlas pipeline. No underlying hourly data table is published; the curves are graphical representations only.
- Known gaps: Hourly load shape is read visually from the published chart, not from a downloadable data table. Historical load curves for prior years are not consistently published in the same format.
Caveats
- Graphical extraction: The load curve is extracted as an image, not as a machine-readable time series. Quantitative readings (e.g., exact MW at each hour) are approximate.
- Single-year snapshot: FY 2024/25 peak day (10 June 2025) is a pre-monsoon peak; the winter peak shape may differ.
- No hourly data table: NEA does not publish the underlying hourly MW values that produced the curve.
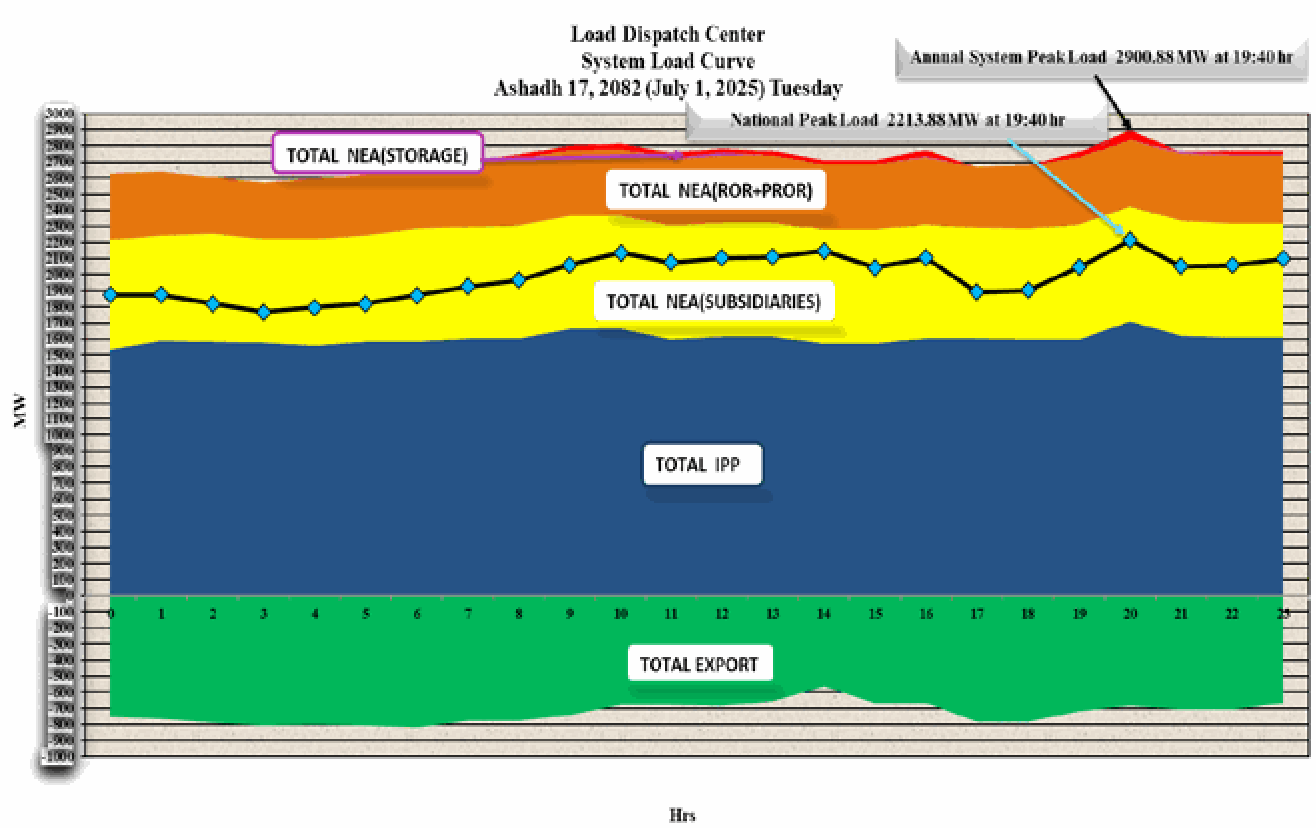
The NEA annual report for FY 2024/25 publishes the integrated Nepal power system's annual system peak-load curve and a representative daily load curve for the FY's peak day (27 Jestha 2082 / 10 June 2025). Together they are the canonical reference shape for Nepal's seasonal and intraday demand profile for the year, used elsewhere in this wiki to reason about stranded generation, seasonal arbitrage, and the evening-peak import dependence.
The chart image extracted from the annual report is included inline below. The underlying PDF is the NEA Annual Report FY 2024/25 source page.
Why it matters
- Nepal's winter peak sits in the evenings, when hydro availability is lowest and imports from India are most expensive. The shape of the curve is what binds the Seasonal Arbitrage Trap argument.
- The daily shape on the FY peak day shows why Main Load Dispatch Centre sequencing of reservoir draw (Kulekhani) matters so much in the evening block.
- Anyone reading the FY 2024/25 NEA numbers without the load curve can make the mistake of treating the 15,641 GWh annual energy balance as if it flows evenly. It does not.