Domestic Electricity Demand Distribution
- Page status
- Working page
- Updated
- 2026-05-13
Summary
Where Nepal's electricity actually goes — by sector, by consumer category, and how fast it's growing. Central evidence for Domestic-Led Hydro Strategy and the Seasonal Arbitrage Trap value-capture argument.
Key Figure
Simple Explanation
Nepal sells roughly 11,000 GWh of electricity per year. Over 90% of customers are households, but they use only 42% of the power. Industry — just 1.2% of customers — uses 37%. The grid is growing fast (+55% in 4 years) but per-person use is still tiny by global standards: 465 kWh per year vs 2,000–3,000 in middle-income countries. The biggest untapped demand is cooking: fewer than 1% of households cook with electricity.
Coverage / Method
- Data sources: NEA Annual Report FY 2024/25, Distribution and Consumer Services Directorate (sectoral sales, consumer counts, provincial breakdowns); WECS Energy Sector Synopsis FY 2079/80 (per-capita consumption, agricultural energy cross-tab); World Bank Country Economic Memo 2025 and World Bank Economics of Household Cooking Using Electricity in Nepal (cooking electrification baseline).
- Method: Sectoral shares from NEA DCSD sales tables. FY 2020/21 vs FY 2024/25 comparison uses same source methodology across both years. Per-capita consumption calculated from total sales and population estimates.
- Known gaps: NEA does not report agricultural electricity separately (falls under "Others"); electric cooking figure (0.5%) is from the 2021 baseline and is corroborated only as "less than one percent" in the 2025 cooking-economics source, not annually updated; load profile is from monthly operational reports, not continuous metering.
Caveats
- Single-fiscal-year snapshot: FY 2024/25 data; sectoral shares may shift as industrial load grows.
- Cooking statistic remains a baseline: 0.5% electric cooking comes from the 2021 baseline. A 2025 World Bank-linked cooking-economics report still describes electric cooking as below one percent but does not provide a newer annual national share.
- "Others" category is heterogeneous: Agricultural, street lighting, temporary, and water supply are combined; agriculture-only slice is estimated at 200–350 GWh.
- Per-capita figures are approximate: Based on national population estimates, not metered consumer counts.
Where Nepal's electricity actually goes — by sector, by consumer category, and how fast it's growing. Central evidence for Domestic-Led Hydro Strategy and the Seasonal Arbitrage Trap value-capture argument.
Sectoral Demand Split — FY 2024/25 (NEA)
Total electricity sales: 11,288 GWh (including internal consumption). Total consumers: 5,707,528. Source: NEA Annual Report FY 2024/25, Distribution & Consumer Services Directorate.
| Category | Share of Consumers | Share of Sales | Share of Revenue | Sales (GWh approx.) |
|---|---|---|---|---|
| Domestic (residential) | 91.08% | 42.02% | 39.05% | ~4,742 |
| Industrial | 1.23% | 36.64% | 36.52% | ~4,136 |
| Commercial | 0.77% | 7.79% | 11.33% | ~879 |
| Non-Commercial | 0.72% | 3.07% | 4.47% | ~347 |
| Others (streetlight, irrigation, temp, etc.) | 6.21% | 10.48% | 8.62% | ~1,183 |
Sectoral Shift — FY 2020/21 vs FY 2024/25
| Category | FY 2020/21 Sales | FY 2024/25 Sales | Change | CAGR |
|---|---|---|---|---|
| Domestic | ~3,138 GWh (43.1%) | ~4,742 GWh (42.0%) | +51% | ~10.8% |
| Industrial | ~2,816 GWh (38.7%) | ~4,136 GWh (36.6%) | +47% | ~10.1% |
| Commercial | ~511 GWh (7.0%) | ~879 GWh (7.8%) | +72% | ~14.5% |
| Non-Commercial | ~204 GWh (2.8%) | ~347 GWh (3.1%) | +70% | ~14.2% |
| Others | ~614 GWh (8.4%) | ~1,183 GWh (10.5%) | +93% | ~17.8% |
| Total | ~7,277 GWh | ~11,288 GWh | +55% | ~11.6% |
Three pattern observations:
Domestic and industrial grew at roughly the same pace (~10-11% CAGR). This is notable given the WB CEM finding that manufacturing output fell to ~6% of GDP — implying industrial electricity growth may reflect process switching (electric vs thermal) and/or new capacity rather than manufacturing expansion.
"Others" is the fastest-growing category (+93%), driven by streetlight electrification, irrigation pump connections, and temporary construction supply — the long tail of grid extension.
Domestic share is gently declining (43.1% → 42.0%) while industrial share is also declining (38.7% → 36.6%). The growth is in commercial, non-commercial, and others — the smaller categories gaining share as electrification deepens beyond basic household connections. This is structurally healthy: it means the grid is reaching firms, institutions, and public infrastructure, not just homes.
Total System Energy Balance
FY 2024/25
| Metric | Value |
|---|---|
| Total available energy | 15,641 GWh |
| NEA + subsidiaries share | 34% |
| IPP share | 55% |
| Import from India share | 11% |
| Total domestic consumption | 11,343 GWh |
| Export to India | 2,380 GWh |
| Net export | 699 GWh |
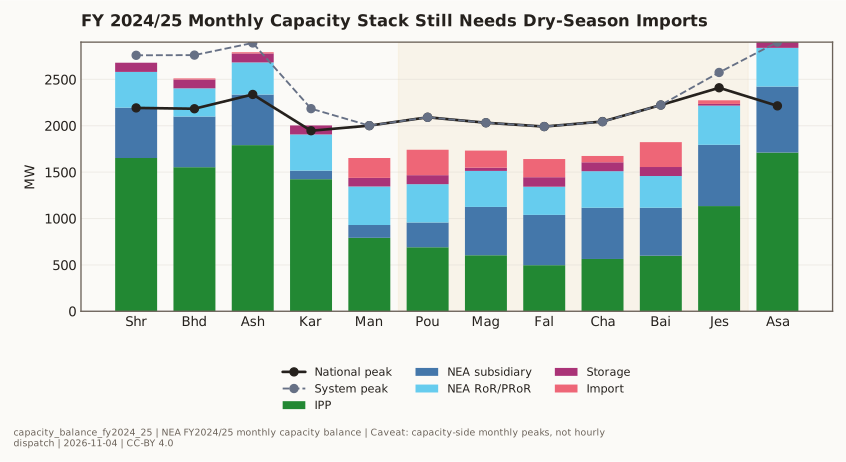
| System peak demand | 2,901 MW (Jul 1, 2025) |
| National peak demand | 2,409 MW (Jun 10, 2025) |
FY 2020/21 (for comparison)
| Metric | Value |
|---|---|
| Total consumption | 7,319 GWh |
| NEA own generation share | 31.66% |
| IPP generation share | 36.51% |
| Import from India share | 31.83% |
| System loss | 17.18% |
Per-Capita Consumption Trend
| Year | Per-capita (kWh/yr) | Source |
|---|---|---|
| 2012 | ~100 | Estimated |
| 2018 | ~200 | WB CEM baseline |
| FY 2020/21 | ~370 | NEA DCSD |
| FY 2023/24 | ~400 | NEA Annual Report |
| FY 2024/25 | 465 | NEA Annual Report |
Load Profile — Evening Peak Dominates
Monthly operational reports show peak demand consistently hitting 18:30–19:25 — the daily cooking-and-lighting window. This pattern persists in FY 2024/25:
- System peak of 2,901 MW recorded on July 1, 2025 (13 Jestha 2082) — of which 2,214 MW was internal demand and 687 MW exported
- National peak of 2,409 MW recorded on June 10, 2025
- Winter peak hours still require import support: structural mismatch between RoR flat-ish output and evening spike
The structural features have not changed since FY 2020/21:
- Run-of-river hydro generates at near-constant output (flow-following)
- Demand spikes in the evening when people return home
- The mismatch is most acute in dry-season evenings, when hydro output is at its annual floor and demand at its daily peak
This evening peak pattern is what makes storage + solar the physical complement to the hydro fleet. See Nepal Peak Load Curve FY 2024/25 for the annual load shape.
The Electrification Gaps — Where Demand Is Not Yet Created
Electric cooking: the largest untapped demand
- Electric cooking used by 0.5% of households in the 2021 baseline; World Bank Economics of Household Cooking Using Electricity in Nepal still describes adoption as below one percent rather than replacing the baseline with a newer annual share.
- Biomass (firewood) and imported LPG dominate cooking energy
- NEA's FY 2024/25 report explicitly flags government policy to "encourage the use of electricity for cooking, transportation, and industry to reduce reliance on fossil fuels"
The current public corpus does not contain a metered national scenario for the electricity demand created by a 20–30% cooking transition. Energy Substitution Pathway discusses the substitution logic, but modelled scenarios must remain separate from observed demand.
Residential electricity still dominated by lighting
- Household electricity use has tripled since 2010, but remains only ~5% of residential energy (the rest is biomass + LPG)
- 92.2% of households used electricity for lighting in 2021 (up from 67.3% in 2011) — lighting drove the first wave of residential electrification
- The second wave — cooking, heating, appliances — has barely started
Value-Capture Framing
Electricity captures higher value when it serves scarce periods (dry-season firm power, peak hours) and high-productivity uses. Nepal's current position:
- Dry-season firm power: partially priced (storage PPA winter rate NPR 14.80/unit)
- Export revenue: averaging NPR 7.11–8.72/unit in monsoon
- Domestic industrial tariff: peak hours NPR 10.00–10.20/unit
Electric cooking is a large candidate demand pool, but its national load effect depends on adoption, appliance efficiency, meal timing, fuel stacking and feeder readiness. The copied public corpus does not contain a metered national conversion scenario. See Energy Substitution Pathway for substitution logic and Consumption Trajectory Outlook for forward growth; the argument for prioritising domestic electrification remains explicitly editorial in Twenty-Year Strategy and Domestic-Led Hydro Strategy.
Linked Data
- nea_monthly_energy_balance_fy2024_2025.csv — monthly demand, imports, storage generation, and supply composition.
- nea_monthly_capacity_balance_fy2024_2025.csv — monthly capacity-side view of imports, storage MW, and peak demand.
Linked Figures
- capacity_balance_fy2024_25.svg — canonical monthly capacity stack against national and system peak demand.

Chart Specification
The inline capacity-balance chart covers the monthly peak-demand view. Remaining useful visuals would be: sectoral sales split, sectoral consumption growth from FY 2020/21 to FY 2024/25, and a per-capita consumption line against a middle-income benchmark.
Related
- Electricity Consumption Geographic Distribution — provincial/regional breakdown
- Industrial Electricity Consumers in Nepal — which industries are the top consumers
- Agricultural Energy Consumption — agricultural energy profile
- Nepal Final Energy Mix — the total-energy denominator
- Energy Substitution Pathway — what non-electric flows electrification would displace
- Consumption Trajectory Outlook — forward growth outlook
- Seasonal Arbitrage Trap — the trade cost of not building domestic demand
- Domestic-Led Hydro Strategy — the strategic response
- Stranded Generation — monsoon surplus that domestic load could absorb
- Nepal Electricity Authority (NEA) — the utility that must enable this demand growth