Nepal Electricity Authority (NEA)
- Page status
- Registry record
- Updated
- 2026-05-21
Summary
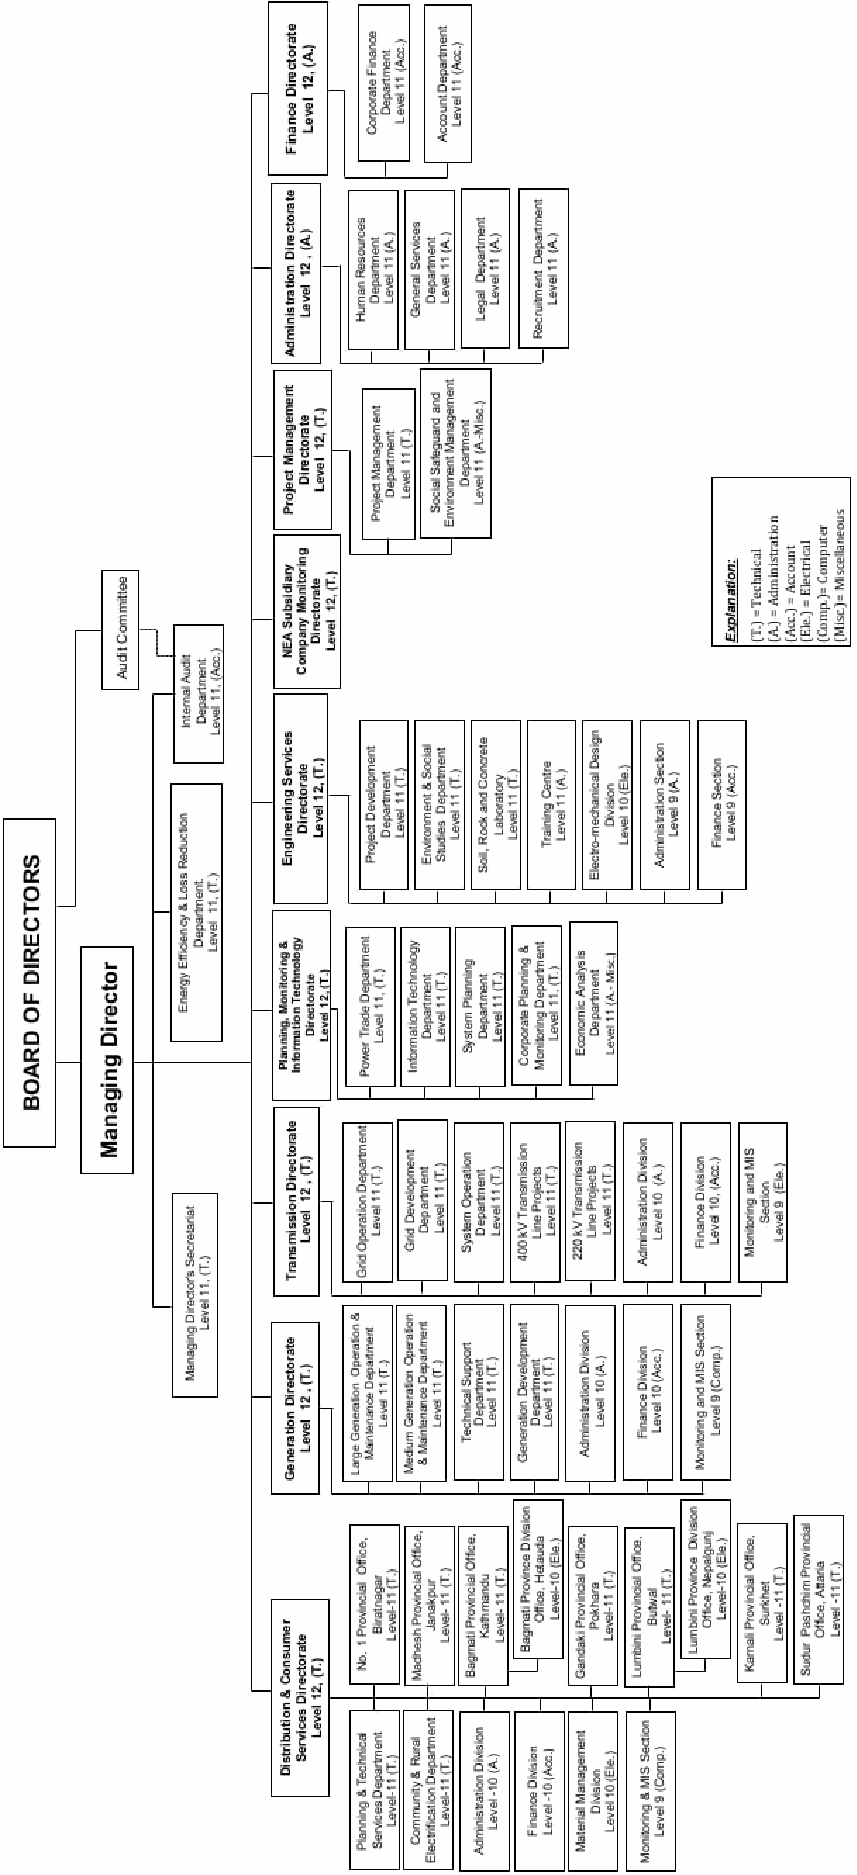
Nepal's central electricity institution. Simultaneously serves as primary generator, monopsony buyer, and sole grid operator — a combination that creates structural conflicts of interest.
Roles
| Role | Description |
|---|---|
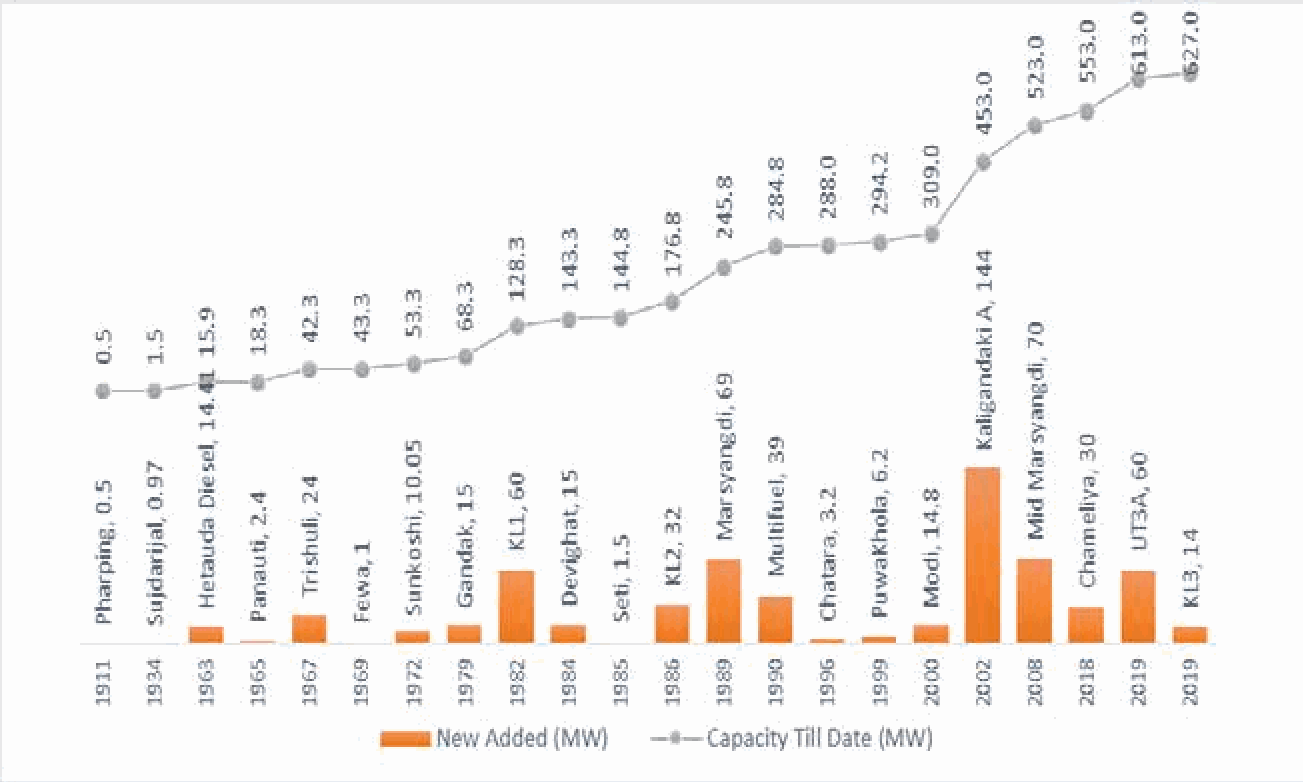
| Generator | Operates NEA-owned plants (Kulekhani, Kali Gandaki A, etc.) |
| Single buyer | Purchases all IPP output through long-term PPAs |
| Grid operator | Runs the Integrated Nepal Power System (INPS) |
| System planner | Coordinates dispatch via Load Dispatch Center |
Key Facts
- NEA and subsidiaries: ~36% of installed hydro; IPPs: ~64%
- Total system loss: 12.26% (FY 2024/25)
- Eliminated scheduled load shedding in 2018
- 76% of firms still reported regular outages in 2022
- National grid coverage: 97.6% (FY 2024/25). NEA consumer-category shares should not be read as household access rates.
Financial Health (FY 2024/25)
| Metric | FY 2023/24 | FY 2024/25 | Change |
|---|---|---|---|
| Profit before tax (NPR B) | 14.46 | 9.06 | −37.3% |
| Revenue from electricity sales (NPR B) | — | 125.27 | +8.46% |
| Total income (NPR B) | — | 138.87 | — |
| Total operating expenses (NPR B) | — | 97.79 | +10.15% |
| Electricity purchase cost (NPR B) | — | 77.10 | +11.73% |
| Total assets (NPR B) | — | 684.91 | +6.2% |
| Forex losses (NPR B) | — | ~2.50 | (yen appreciation) |
May 2025 white paper (new MD Hitendra Dev Shakya) contested the previous management's claimed NPR 8B profit, revealing a NPR 5.26B loss and total liabilities of NPR 385 billion (including NPR 171.4B in long-term foreign loans under government guarantee). The discrepancy between the audited profit and the white-paper loss figure reflects different accounting treatments and periods — but signals that NEA's true fiscal position is worse than public-facing reports suggest.
- Debt Service Coverage Ratio: 2.27 (above 1.2 minimum — still comfortable)
- Return on Historic PPE: 4.50% (below 6% requirement)
- Debt-Equity Ratio: 47.59:52.41
Institutional Issues
- Frequently dominates policy landscape, leaving the Electricity Regulatory Commission (ERC) sidelined
- Generation licensing not coordinated with transmission line planning
- Inter-agency disputes over EIAs, land acquisition, and forest clearance delay projects
- The single-buyer model limits market flexibility and creates PPA liability risk
- PPA liability exposure is growing: electricity purchase costs rose 11.73% in one year to NPR 77.1B, while export prices (the revenue relief valve) are falling — creating a structural squeeze between obligated payments to IPPs and realized market income
- Leadership instability: MD changeover (Ghising to Shakya, April 2025) resulted in dueling public narratives about NEA's financial health
Limitations & Controversies
Financial reporting ambiguity. The May 2025 white paper by new MD Hitendra Dev Shakya revealed a NPR 5.26B loss and NPR 385 billion in total liabilities, contradicting the previous management's claimed NPR 8B profit. The discrepancy signals that NEA's true fiscal position may be worse than public-facing reports suggest.
Leadership instability. The April 2025 MD changeover (Ghising to Shakya) produced dueling public narratives about financial health, creating policy uncertainty and complicating long-term planning.
Structural conflict of interest. NEA simultaneously serves as primary generator, monopsony buyer, and sole grid operator — a combination that limits market flexibility, sidelines the Electricity Regulatory Commission, and creates concentrated PPA liability risk.
Growing PPA liability squeeze. Electricity purchase costs rose 11.73% in one year to NPR 77.1B, while export prices (the revenue relief valve) are falling — creating a structural squeeze between obligated payments to IPPs and realized market income.
Related
- Stranded Generation — NEA's grid cannot absorb what generators produce
- Seasonal Arbitrage Trap — NEA manages the import/export trade that produces value loss
- India — Energy Relationship with Nepal — NEA is the counterpart for cross-border commercial arrangements