Hydropower Potential Pyramid
- Page status
- Working page
- Updated
- 2026-05-13
Summary
The reduction from theoretical potential to actually installed capacity. The 28x gap reflects successive filtering from theoretical potential to installed capacity, with each filter representing a systems constraint rather than a resource absence. For the interpretive framing of this gap as a systems-conversion failure, see Master Thesis and Bottleneck Hierarchy.
Key Figure
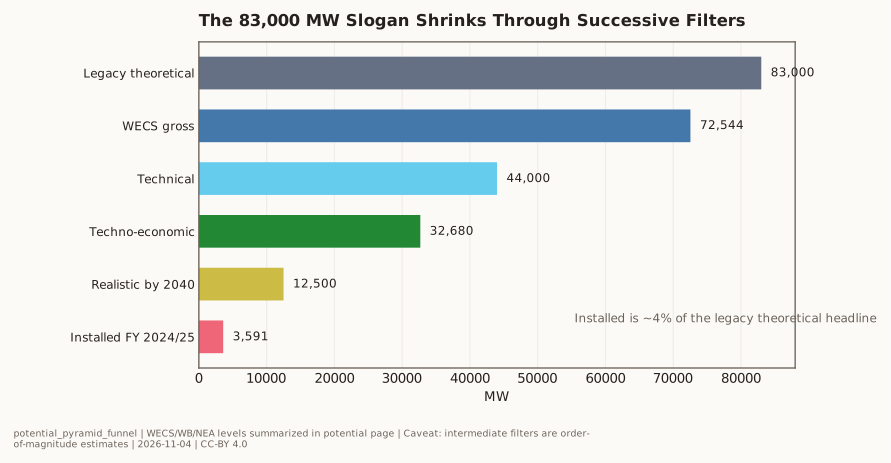
The Pyramid
| Level | Capacity (MW) | What It Means | Source |
|---|---|---|---|
| Theoretical (legacy) | 83,000–83,500 | Every drop at every elevation, perfect efficiency | Historical / political |
| Gross (WECS 2019) | 72,544 | Updated screening with revised methodology | WECS Assessment of Hydropower Potential of Nepal (2019) |
| Technical | ~42,000–46,000 | Apply realistic efficiency, environmental minimums | World Bank Nepal Power-Sector Evidence Record (2018–2025), WECS |
| Techno-economic (WECS 2019) | 32,680 | Screened for development realism | WECS Assessment of Hydropower Potential of Nepal (2019) |
| Economically viable (range) | 25,000–35,000 | Add transmission, terrain, social, financial constraints | source-review estimate |
| Realistically developable by 2040 | 10,000–15,000 | Add financing limits, institutional capacity, geopolitics | source-review estimate |
| Actually installed (FY 2024/25 NEA cut-off) | 3,591 | Annual-report installed generation snapshot | NEA Annual Report FY 2024/25 |
| DoED registry (>1 MW plants, Apr 10 2026) | 3,791.874 | More current licensing-registry operating tally | DoED registry used in Nepal Energy Profile |
Basin Distribution of Gross Potential (WECS 2019)
| Basin | Gross Potential (MW) | Share |
|---|---|---|
| Koshi Basin | 27,805 | 38.3% |
| Karnali Basin | 20,385 | 28.1% |
| Gandaki Basin | 19,803 | 27.3% |
| All other basins | ~4,551 | 6.3% |
| Total | 72,544 | 100% |
~94% of gross potential is concentrated in the three major Himalayan basins.
Key Distinctions
These categories are routinely conflated in Nepal's public discourse:
| Category | What It Is | What It Is NOT |
|---|---|---|
| Installed MW | Nameplate scale | When energy arrives or how dependable it is |
| Annual GWh | Total generation over a year | Dry-season availability |
| Firm Power | Dependable year-round dispatchable output | Same as installed capacity |
| Export-grade power | Firm, bankable, transmission-connected | Seasonal surplus dumped at spot prices |
Coverage / Method
This pyramid is compiled from multiple sources with different methodologies:
- WECS 2019 gross potential: Basin-scale GIS screening with revised hydrology and efficiency assumptions.
- Technical / techno-economic levels: WECS screening plus World Bank power-sector reform assessment constraints.
- Economically viable / realistically developable: Expert estimates from source-review synthesis; not hard thresholds.
- Installed / DoED registry: Administrative counts from NEA annual reports and Department of Electricity Development licensing data.
Intermediate levels (economically viable, realistically developable) are order-of-magnitude estimates, not precise cutoffs. They should not be cited as definitive ceilings.
Caveats
- Intermediate levels (economically viable, realistically developable) are expert estimates, not hard thresholds.
- The "realistically developable by 2040" figure depends on financing, institutional capacity, and geopolitical assumptions that are not model-derived.
- Basin distribution reflects gross potential only; installed capacity distribution differs because buildability, transmission, and market access vary by basin.
- The 83,000 MW legacy figure is politically durable but methodologically outdated.
Linked Data
- No dedicated merged CSV exists for the full pyramid yet.
- Closest machine-readable companions:
- wecs_hydropower_potential_2019.txt — text extraction of the WECS potential report.
- naxa_hydropower_projects.csv — project geography and licensing-stage pipeline data.
Linked Figures
- potential_pyramid_funnel.svg — canonical potential-to-installed-capacity funnel.
- wecs_basin_potential.svg — canonical basin distribution of gross potential.
- hydropower_license_map.png — geographic spread of licensed projects.

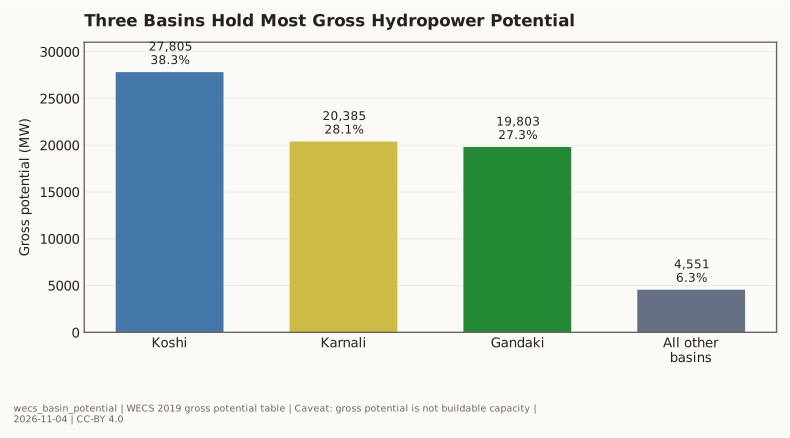
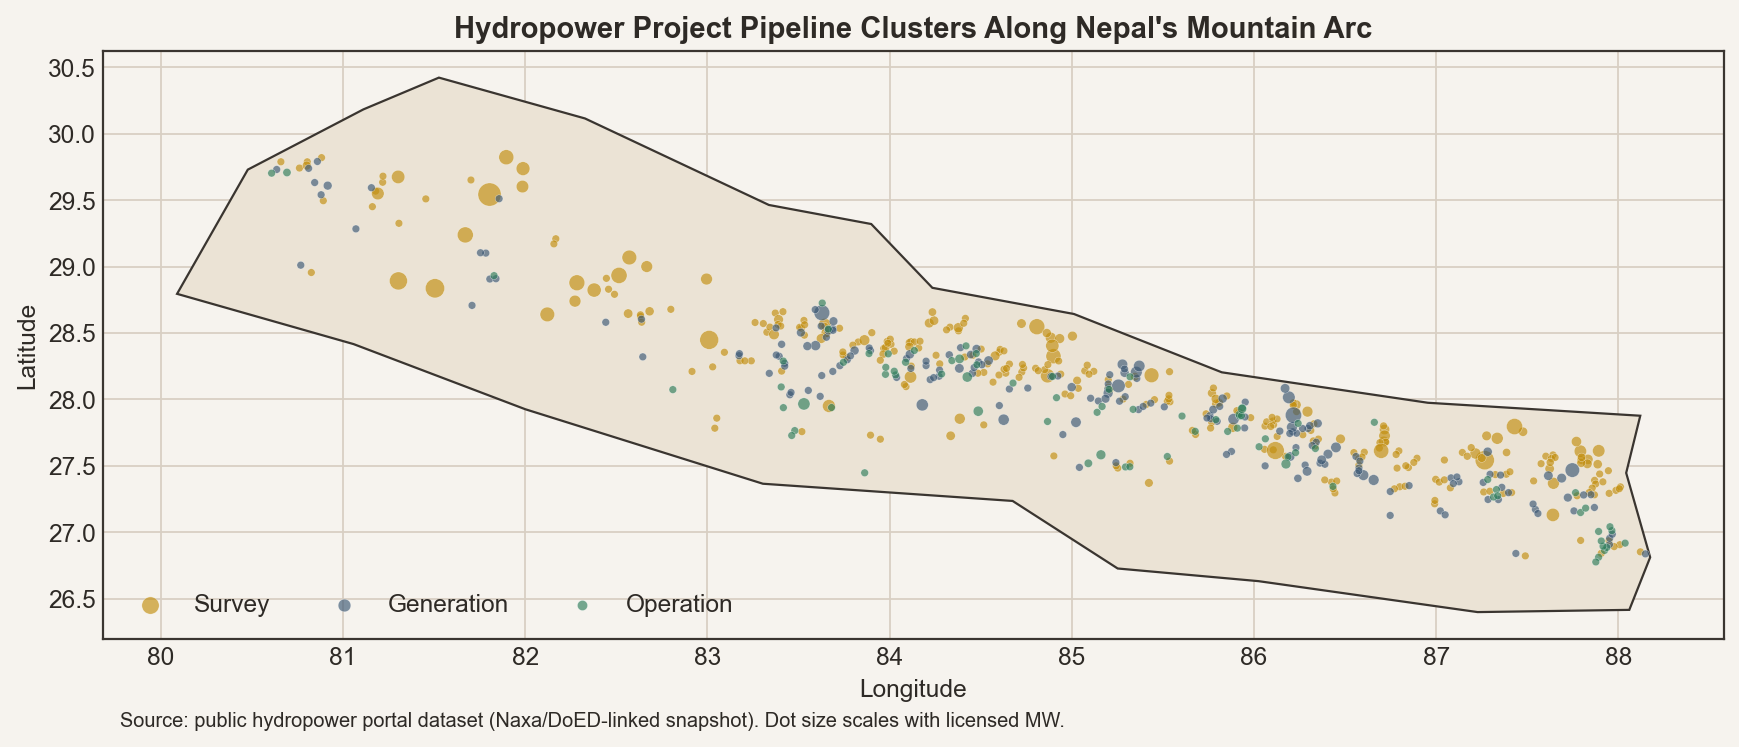
Chart Specification
The inline funnel chart now shows the progressive reduction from 83,000 MW to 3,591 MW. The basin-potential figure remains the geographic companion to this page.