Hydropower Fleet Composition
- Page status
- Working page
- Updated
- 2026-11-04
Summary
Nepal's installed hydropower fleet, broken down by technology type. The RoR dominance is the structural cause of Seasonal Mismatch in generation.
Key Figure
Coverage / Method
- Data sources: NEA Annual Report FY 2024/25 (installed capacity, generation mix); NEA FY 2022/23 review (fleet-type percentages); WECS Energy Synopsis 2024 (generation data); World Bank Country Economic Memo 2025 (capacity timeline).
- Method: Fleet-type shares from NEA review documents. Generation seasonal split from NEA operating statistics. Ownership split from NEA annual report generation-directorate data. Capacity timeline assembled from multiple source cutoffs (note date gaps).
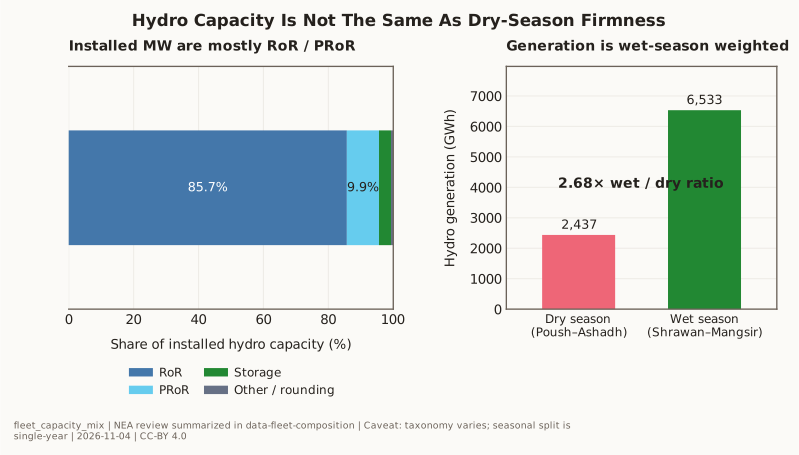
- Known gaps: Fleet-type percentages (85.7% RoR, 9.9% PRoR, 3.7% storage) are from FY 2022/23 review and may shift slightly as new projects commission. The DoED registry snapshot (3,791 MW, Apr 2026) includes projects >1 MW but classification boundaries vary by source.
Caveats
- Classification sensitivity: What counts as PRoR vs daily pondage vs "storage" varies by license, design, and reporting line in NEA statistics. Headline percentages should be tied to an explicit taxonomy when used in formal models.
- Date gaps in capacity timeline: The 2,800 MW (FY 2022/23), 2,990 MW (end-2024), and 3,591 MW (FY 2024/25) figures reflect different cutoff dates and accounting scopes — not error.
- Generation split is single-year: FY 2022/23 wet/dry ratio (2.68x) may vary year-to-year with hydrology.
- Pipeline vs operating: The 572-project CSV includes licensed but not-yet-operating projects; do not conflate with installed-capacity accounting.
Nepal's installed hydropower fleet, broken down by technology type. The RoR dominance is the structural cause of Seasonal Mismatch in generation.
Fleet by Type
| Type | Share of Installed Capacity | Characteristics | Source |
|---|---|---|---|
| Run-of-River (RoR) | ~85.7% | No storage; output mirrors river flow | NEA FY 2022/23 review |
| Peaking Run-of-River (PRoR) | ~9.9% | Small daily pondage; 2–6 hrs peaking | NEA FY 2022/23 review |
| Reservoir / Storage | ~3.7% | Seasonal regulation; only Kulekhani Cascade | NEA FY 2022/23 review |
Current Operating Register (DoED, updated 2 July 2026)
The Department of Electricity Development's operating-plant register, captured in data/processed/tables/doed_hydropower_registry.csv, lists 213 operating hydropower records totalling 3,909.721 MW. Kulekhani I (60 MW), II (32 MW) and Third (14 MW) total 106 MW, or 2.71% of that register. They are the only operating seasonal-storage cascade.
The register does not assign a hydraulic type to each plant. Published sources checked for TransparentGov's film typed 44 plants (2,577 MW): 33 run-of-river (1,605 MW), 8 peaking run-of-river (866 MW) and the 3-plant Kulekhani cascade (106 MW). The remaining 169 records (about 1,333 MW) have no published type, so no full-register RoR or PRoR percentage is computed here. See Film Evidence: Nepal Has Hydropower. Why Isn't It Enough? for the typing sources.
Installed Capacity Timeline
| Date | Total Installed (MW) | Source |
|---|---|---|
| FY 2022/23 | ~2,800 | NEA FY 2022/23 |
| End 2024 | ~2,990 | World Bank Nepal Country Economic Memorandum (2025) |
| FY 2024/25 | 3,591.262 (total) / 3,389.912 (hydro) | NEA Annual Report FY 2024/25 |
| Apr 10 2026 | 3,791.874 (>1 MW hydro plants in DoED registry) | DoED registry snapshot used in Nepal Energy Profile |
Generation Seasonal Split (FY 2022/23)
| Season | Hydro Generation (GWh) | Share |
|---|---|---|
| Dry season | 2,437 | ~27% |
| Wet season | 6,533 | ~73% |
| Wet/dry ratio | 2.68x |
Ownership Split
- IPPs: 64% of installed hydropower by 2024
- NEA and subsidiaries: remaining ~36%
70% of capacity added since 2018 came from IPPs
Linked Data
- nea_monthly_capacity_balance_fy2024_2025.csv — monthly capacity contribution by IPPs, NEA, imports, and storage.
- naxa_hydropower_projects.csv — 572 project records with coordinates, license stage, promoter, and river; useful for separating operating hydro from the broader development pipeline.
Linked Figures
- fleet_capacity_mix.svg — canonical fleet capacity mix and seasonal generation figure.
- capacity_balance_fy2024_25.svg — monthly capacity stack against national and system peak demand.
- license_type_mix.svg — pipeline split by license stage.
- top_operational_projects.svg — concentration of operating MW in a small set of plants.

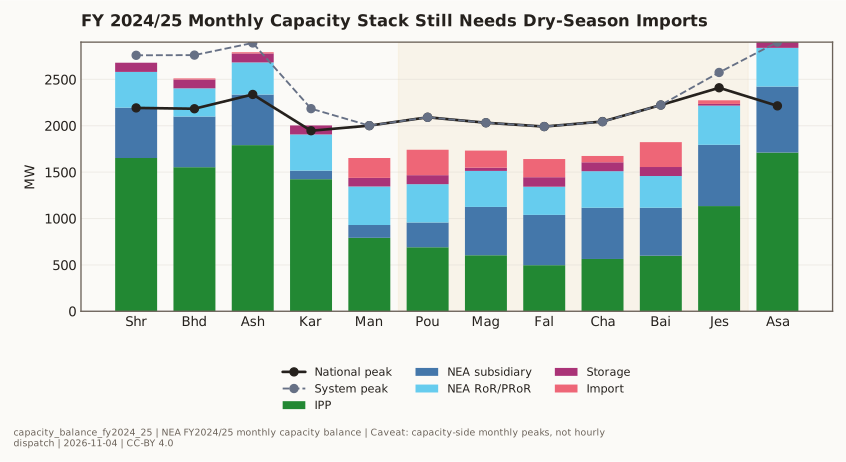
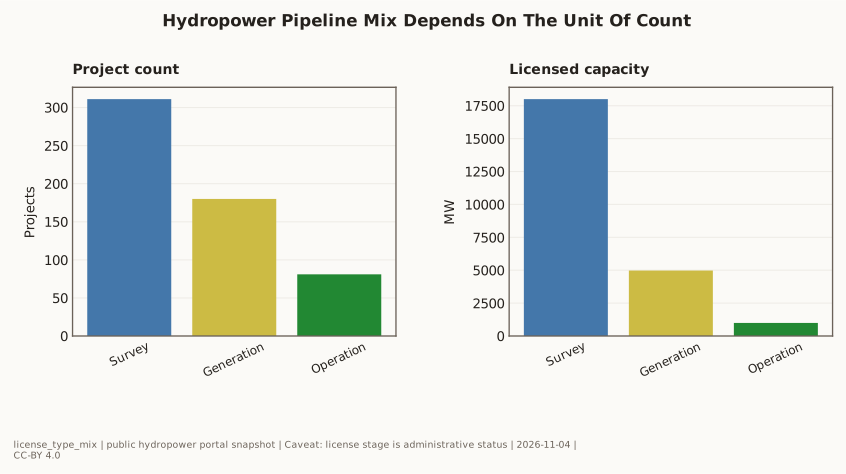
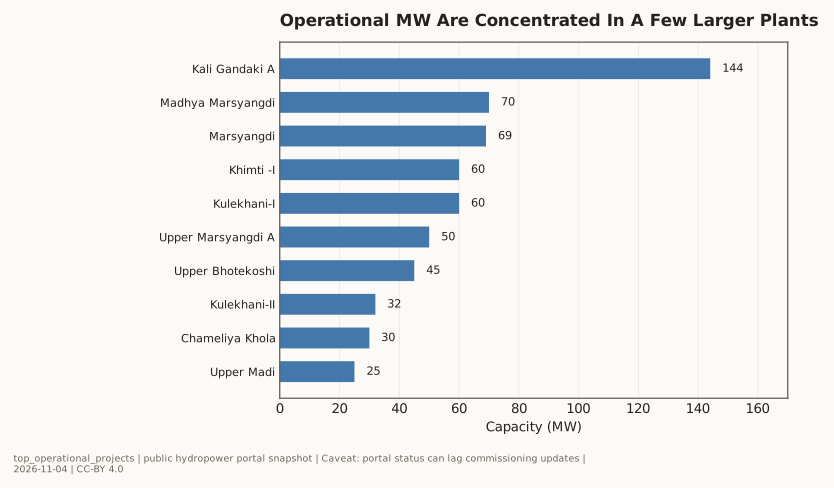
Chart Specification
Stacked bar chart: RoR / PRoR / Storage shares of installed capacity, with a second bar showing their shares of dry-season generation. The disparity between capacity share and dry-season contribution makes Firm Power vs MW distinction visually clear.