Storage Capacity Comparison
- Page status
- Working page
- Updated
- 2026-05-13
Summary
Nepal's water storage infrastructure compared to regional and global peers. This is the single most dramatic infrastructure gap in the entire analysis.
Key Figure
Coverage / Method
- Data sources: World Bank Water Sector Diagnostic (storage requirement, active storage); World Bank Ganges Strategic Basin Assessment (regional comparisons); JICA IPSDP (storage hydropower MW targets); Oxford University Blakers et al. 2021 (off-river pumped hydro screening).
- Method: Per-capita storage from global dam databases and country-specific assessments, normalized to population. Nepal storage from Kulekhani cascade operational data. Storage requirement (29.86 km³) from WB water-sector-wide estimate. Pumped-hydro potential from GIS-based off-river site screening using 3-arc-second DEM and 500 ha reservoir threshold.
- Known gaps: Active vs total reservoir volume boundaries differ across sources (85 MCM active vs 130–150 MCM total). Off-river pumped-hydro screening is GIS-based theoretical potential, not feasibility-assessed projects.
Caveats
- Storage-gap framing: The 29.86 km³ requirement is a water-sector-wide estimate (irrigation + energy + other uses), not an electricity-only storage target.
- Active vs total ambiguity: The ~85 MCM active storage and 130–150 MCM total figures differ by boundary definition. Both are negligible relative to need.
- Off-river potential is theoretical: The ~2,800 sites / 50 TWh figure is a GIS screening result, not a bankable project pipeline. Site-specific feasibility studies would reduce the realizable fraction.
- Regional comparisons are illustrative: Per-capita storage varies by geography, climate, and measurement methodology; direct Nepal-vs-Norway comparison is valid for scale but not for policy prescription.
Nepal's water storage infrastructure compared to regional and global peers. This is the single most dramatic infrastructure gap in the entire analysis.
Per-Capita Dam Storage
| Country | Per-Capita Storage (m³/person) | Notes | Source |
|---|---|---|---|
| Norway | ~15,100 | Wide glacial valleys, stable geology, hydro model | Source review |
| China | ~664 | Massive dam-building programme | Source review |
| Global average | ~900 | Source review | |
| India | ~180 | Itself criticized as inadequate | Source review |
| Nepal | ~5 | Almost entirely Kulekhani Cascade | Source review |
Nepal has 1/36th of India's per-capita storage, which is itself well below global average.
Nepal's Current Storage
| Facility | Capacity (MW) | Storage Volume | Generation (FY 2024/25) |
|---|---|---|---|
| Kulekhani I | 60 | ~85 MCM active | |
| Kulekhani II | 32 | (cascade) | |
| Kulekhani III | 14 | (cascade) | |
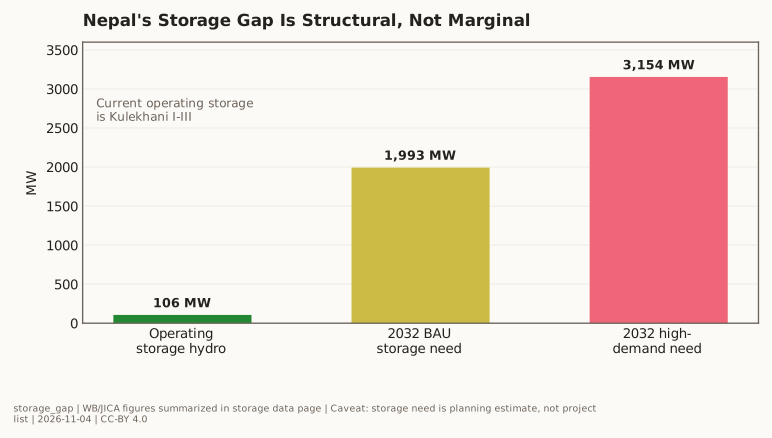
| Total | 106 | ~85–150 MCM | 279.8 GWh |
Storage Need
- Seasonal storage requirement: 29.86 km³ (World Bank Nepal Water Sector Diagnostic)
- Current storage: ~0.085–0.15 km³
- Gap: ~200x shortfall
- JICA estimate: 1,993–3,154 MW of storage hydropower by 2032
Dry-Energy Shortlist From The Merged Research Workspace
The code repo added a machine-readable shortlist that is more useful than headline MW alone because it ranks projects by dry-energy contribution:
| Project | Basin | Installed MW | Dry Energy (GWh) | Dry Share | Why It Matters |
|---|---|---|---|---|---|
| Dudhkoshi Storage Hydroelectric Project | Koshi Basin | 670 | 1,252.0 | 37.1% | Strongest Nepal-side dry-season block in the checked official set |
| Nalsyau Gad | Karnali Basin | 410 | 581.8 | 41.4% | Best dry-energy share in the JICA promising-project shortlist |
| Lower Badigad | Gandaki Basin | 380.3 | 354.7 | 26.0% | Large Gandaki carryover storage with meaningful winter value |
| Naumure (W. Rapti) | West Rapti | 245 | 309.9 | 26.8% | Medium-basin storage with unusually high seasonal-regulation value |
| Sun Koshi No.3 | Koshi Basin | 536 | 335.9 | 17.8% | Large reservoir block with meaningful dry support even if dry share is lower |
Valley-Shape Paradox
| Dam | Height (m) | Storage Volume | Terrain |
|---|---|---|---|
| Aswan (Egypt) | 111 | 162 BCM | Flat desert |
| Andhi Khola (Nepal, proposed) | 110 | 0.9 BCM | V-shaped Himalayan valley |
Same dam height, 180x less storage. Nepal's topography simultaneously enables hydropower (steep head) and prevents easy storage (narrow valleys).
Off-River Pumped Hydro: The Bypass Route
A 2021 Oxford University study (Blakers et al., Clean Energy) identified ~2,800 off-river pumped hydro energy storage sites in Nepal with combined storage capacity of ~50 TWh. In the comparison used here, balancing a 100% renewable Nepal at advanced-economy consumption levels (500 TWh/yr) uses **1.5 TWh** as the storage scale. The cited off-river pumped-hydro potential is roughly 17x that modeled balancing requirement — entirely off-river, avoiding the valley-shape paradox.
This reframes the storage deficit observationally: Nepal has significant off-river pumped-hydro potential (~50 TWh) but very little executed seasonal storage infrastructure. The gap between potential and execution is documented in Master Thesis and Bottleneck Hierarchy as a systems-conversion failure, not a geological absence. See also Mountain Hydro System Comparison.
Linked Data
- nepal_storage_dry_energy_shortlist.csv — 12-project storage shortlist with total storage, effective storage, annual energy, dry energy, and editorial priority notes.
Linked Figures
- storage_gap.svg — canonical current storage versus JICA-estimated storage need figure.

Chart Specification
Bar chart of per-capita storage across countries (log scale recommended given the range from 5 to 15,100). Nepal's bar should be visually striking. Second panel: the valley-shape paradox as a simple side-by-side cross-section diagram. Third panel: Nepal's 50 TWh pumped-hydro potential vs 1.5 TWh need — a simple ratio bar.