Electricity Trade Time Series
- Page status
- Working page
- Updated
- 2026-05-13
Summary
Nepal's electricity trade transformation from net importer to seasonal exporter. Central evidence for Seasonal Arbitrage Trap and Seasonal Mismatch.
Key Figure
Annual Import/Export Volumes
| Year | Import (GWh) | Export (GWh) | Net Position | Source |
|---|---|---|---|---|
| 2018 | ~2,582 | ~3 | Heavy importer | World Bank Nepal Country Economic Memorandum (2025) |
| FY 2020/21 | ~2,330 | — | Heavy importer; imports 31.83% of supply | NEA annual report (Part 7) |
| FY 2079/80 (~2022/23) | 1,854.5 | 1,333.1 | Net importer (~521 GWh) | NEA System Operation Dept (Part 7) |
| FY 2023/24 | 1,845 | 1,946 | First full net exporter year | NEA summary |
| FY 2024/25 | 1,681 | 2,380 | Net exporter (699 GWh) | NEA Annual Report FY 2024/25 |
Data Reconciliation Notes
The merged code workspace surfaced an NEA internal mismatch that should be preserved, not hidden:
| NEA view of FY 2024/25 trade | Import (GWh) | Export (GWh) | Best use |
|---|---|---|---|
| Narrative summary | 1,681 | 2,380 | Headline annual trade framing |
| Monthly energy-balance table | 1,712 | 2,380 | Monthly system-shape analysis |
| Multi-year trade comparison chart | 1,711.5272 | 2,331.7360 | Multi-year monthly trade comparison |
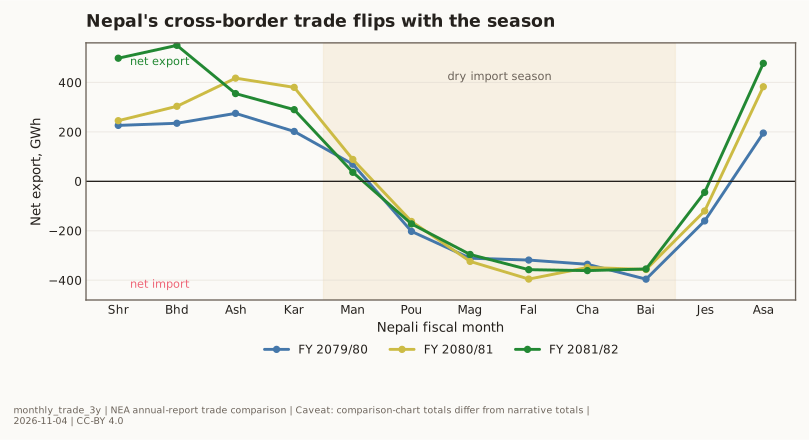
Monthly GWh Breakdown — FY 2079/80 (~2022/23)
The first month-by-month import/export resolution in the entire research corpus. Source: NEA System Operation Department operational report.
| Nepali Month | Gregorian Approx. | Import (GWh) | Export (GWh) | Net (Import–Export) |
|---|---|---|---|---|
| Shrawan | mid-Jul–mid-Aug | 25.5 | 251.6 | −226.1 (net export) |
| Bhadra | mid-Aug–mid-Sep | 20.9 | 255.7 | −234.8 (net export) |
| Ashwin | mid-Sep–mid-Oct | 6.1 | 281.0 | −274.9 (net export) |
| Kartik | mid-Oct–mid-Nov | 0.5 | 202.3 | −201.7 (net export) |
| Mangsir | mid-Nov–mid-Dec | 18.7 | 87.8 | −69.1 (net export) |
| Poush | mid-Dec–mid-Jan | 202.9 | 0.6 | +202.3 (net import) |
| Magh | mid-Jan–mid-Feb | 311.0 | 0.0 | +311.0 (net import) |
| Falgun | mid-Feb–mid-Mar | 318.5 | 0.0 | +318.5 (net import) |
| Chaitra | mid-Mar–mid-Apr | 335.5 | 0.0 | +335.5 (net import) |
| Baisakh | mid-Apr–mid-May | 395.7 | 0.0 | +395.7 (net import — peak dry) |
| Jestha | mid-May–mid-Jun | 184.4 | 24.2 | +160.2 (net import) |
| Ashar | mid-Jun–mid-Jul | 34.9 | 230.1 | −195.2 (net export) |
Dry season total (Poush–Jestha, Dec–Jun): ~1,748 GWh imported, ~25 GWh exported — net import 1,723 GWh. Monsoon total (Shrawan–Mangsir + Ashar, Jul–Nov + Jun): ~106 GWh imported, ~1,308 GWh exported — net export 1,202 GWh.
Confirming: Nepal earns heavily for 5 months and pays heavily for 7 months. The annual net depends entirely on the price differential between those two bands.
Specific dry-season peaks
- Falgun 2080 (mid-Feb to mid-Mar 2024): 406.3 GWh imported, zero exported in a single month. Import-at-peak hit 643 MW in one day. Evening peak load (18:30–18:55) was when the import dependency was most acute. (NEA monthly operational report)
- Winter import approval: Nepal received approval to import up to 654 MW through key cross-border links for Jan–Mar 2026 — confirming that structural winter deficit persists even with 3,591 MW installed.
Linked Data
- nea_cross_border_trade_monthly_gwh_fy2079_80_to_2081_82.csv — 3-year monthly import/export chart series from NEA annual-report trade tables.
- lead1_monthly_import_export_storage_fy2081_82.csv — monthly panel joining imports, exports, storage generation, and system demand for FY 2081/82.
- nea_trade_chart_monthly_long.csv — reshaped long-form trade table for charting.
- nea_daily_archive_coverage.json — archive-depth scan proving the NEA daily-report stack runs across 64 archive pages and 639 unique BS dates from 2080-01-01 to 2081-09-27.
- nea_daily_trade_parsed.csv — currently checked-in parsed subset from the first 40 daily reports.
- nea_daily_report_manifest.csv — PDF provenance list for the parsed daily subset.
Daily Pipeline Coverage
- Archive depth known: 64 archive pages, 703 raw detail links, 639 unique daily dates.
- Known coverage window: BS 2080-01-01 to 2081-09-27.
- Checked-in parsed slice here: 40 reports covering BS 2081/08/18 to 2081/09/27.
- Implication: the archive itself is much deeper than the currently parsed local subset. For early FY 2079/80 months, the annual report trade chart still remains the authoritative monthly source inside this workspace.
IEX Price Evolution (Exchange Channel)
Source: India Central Electricity Authority / IEX market monitoring report. Trade on India's power exchange (Day-Ahead + Real-Time markets, cross-border transactions with Nepal).
| Year | Nepal buy at IEX (₹/kWh) | Nepal sell at IEX (₹/kWh) | Spread | Implication |
|---|---|---|---|---|
| 2021-22 | 3.59 | 3.20 | −0.39 | Buy more expensive than sell |
| 2022-23 | 5.95 | 5.14 | −0.81 | Spread widens against Nepal |
| 2023-24 | 4.43 | 5.61 | +1.18 | Spread flips positive |
Caveat: whole-system average still negative in FY 2023/24. Even with a positive IEX spread, Nepal's system-wide average for FY 2023/24 was: sold at Rs 8.72/unit, purchased at Rs 9.17/unit — a negative spread of ~Rs 0.45/unit across the full portfolio. This gap reveals that non-IEX procurement (winter peak imports outside the exchange, bilateral arrangements, constrained hours) drives overall costs above what the market data alone would suggest. Nepal is improving its exchange-linked value capture, but the broader portfolio problem persists.
Pricing Data
| Direction | Channel/Season | Price | Source |
|---|---|---|---|
| Export to India | IEX (2023-24 weighted avg) | ₹5.61/kWh (~NPR 7.11) | IEX market monitoring |
| Export to Bangladesh | Bilateral (fixed) | 6.40 US cents/unit | Tripartite PSA |
| Import from India | IEX (2023-24 weighted avg) | ₹4.43/kWh | IEX market monitoring |
| Import from India | Dry season average (broader) | ~NPR 9.17–11.50/unit | NEA / source review |
| Import from India | Peak hour (dry) | up to NPR 16.00/unit | Source review |
| Domestic PPA (storage, winter) | Regulated | capped at NPR 14.80/unit | ERC/NEA |
| Domestic PPA (storage, monsoon) | Regulated | capped at NPR 8.45/unit | ERC/NEA |
| Industrial ToD tariff (domestic) | Peak (17:00–23:00) | ~NPR 10.00–10.20/unit | NEA tariff schedule |
| Industrial ToD tariff (domestic) | Off-peak | ~NPR 4.65–5.25/unit | NEA tariff schedule |
Revenue Data (FY 2023/24)
- Export revenue: NPR 17.1 billion (avg Rs 8.72/unit)
- Import cost: NPR 16.9 billion (avg Rs 9.17/unit)
- Net in GWh: +101 GWh (net exporter)
- Net in cash: ~NPR 200 million — barely positive on revenue despite being a "net exporter"
- This is the Seasonal Arbitrage Trap expressed in NPR: more kWh sold than bought, less money earned than spent
FY 2024/25 Revenue
- Export to India: NPR 17.19 billion (2,340 GWh)
- Export to Bangladesh: NPR 266.98 million (30.39 GWh)
- Total export revenue: NPR 17.46 billion
- Import cost from India: NPR 12.92 billion (~1,300 GWh)
- Net trade surplus: ~NPR 4.5 billion (699 GWh net exports)
FY 2025/26 First Five Months (Jul–Dec 2025)
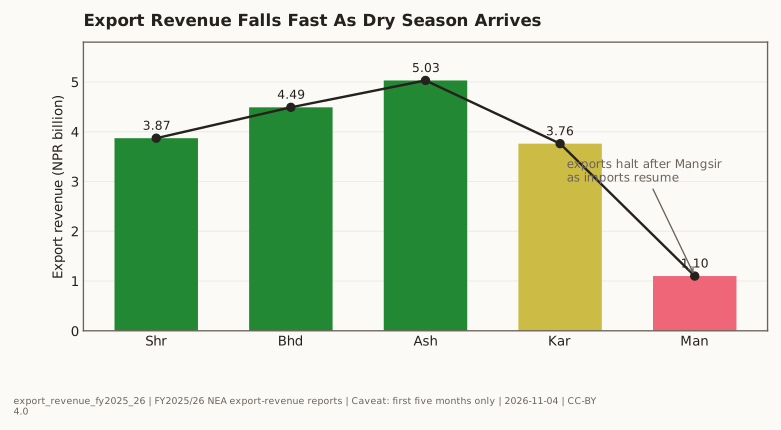
| Month (Nepali) | Period | Export Revenue (NPR B) |
|---|---|---|
| Shrawan | Jul 17–Aug 16 | 3.87 |
| Bhadra | Aug 17–Sep 16 | 4.49 |
| Ashoj | Sep 17–Oct 17 | 5.03 (peak) |
| Kartik | Oct 18–Nov 17 | 3.76 |
| Mangsir | Nov 17–Dec 15 | 1.10 (trough) |
| Total | 18.26 |
- 2,714 GWh exported in 5 months — 38% increase over same period in FY 2024/25
- Bangladesh exports: 147.43 GWh, earning USD 9.436 million (Jun–Nov 2025)
- By mid-December, exports stopped and imports began as dry season set in
System Peak and Capacity (FY 2024/25)
- Total installed capacity: 3,591 MW
- System peak demand: 2,901 MW (July 1, 2025)
- National peak demand: 2,409 MW
- Monsoon peak production: ~3,000 MW, with ~850 MW surplus exported
- Approved export capacity: 941 MW (28 projects approved for Indian market)
- Approved breakdown: 400 MW medium-term bilateral + 540 MW via IEX
Linked Figures
- electricity_trade_shift.svg — pre/post trade-regime crossover graphic.
- monthly_trade_3y.svg — canonical three-year monthly net-trade seasonality figure.
- lead1_fy2081_82_trade_vs_storage.svg — imports, exports, and storage in the same FY 2081/82 frame.
- export_revenue_fy2025_26.svg — first-five-month FY 2025/26 export-revenue curve.
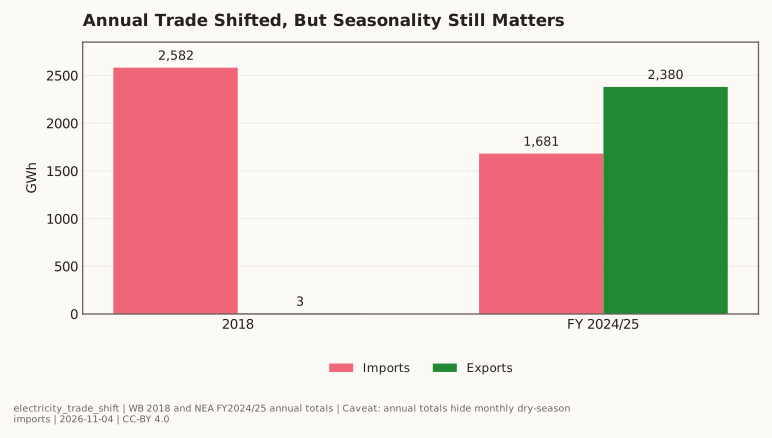

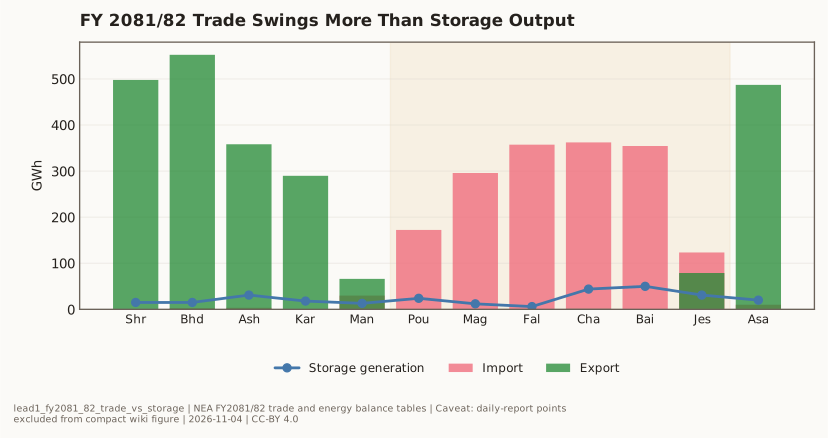

Chart Specification
The linked figures now cover the core annual, monthly net-trade, trade/storage, and first-five-month revenue views. A future full-year revenue curve should replace the current five-month revenue figure once the complete FY 2025/26 series is available.
Coverage / Method
- Data sources: NEA System Operation Department operational reports (monthly GWh, FY 2079/80 through FY 2024/25); NEA Annual Report FY 2024/25 trade tables; India CEA / IEX market monitoring reports (exchange pricing, 2021–2024).
- Method: Monthly import/export volumes from NEA energy-balance tables. IEX spreads calculated as weighted-average buy vs sell prices across Day-Ahead and Real-Time markets for cross-border transactions. Revenue figures from NEA annual report trade revenue statements.
- Reconciliation: Three NEA views of FY 2024/25 trade are preserved (narrative summary 1,681/2,380; monthly table 1,712/2,380; multi-year chart 1,711.5/2,331.7) because they serve different analytical purposes. The wiki does not silently pick one.
- Known gaps: Daily report parsing covers only 40 of 639 available daily reports (BS 2081/08/18–2081/09/27). Early FY 2079/80 months rely on annual-report trade chart, not daily data. IEX spread is exchange-channel only; non-exchange bilateral and peak-hour procurement are not captured in the exchange dataset.
Caveats
- Single-year anomaly risk: FY 2024/25 was Nepal's first sustained net-export year; the monthly revenue pattern may not be stable as export volumes grow.
- IEX ≠ whole system: Positive IEX spread (+₹1.18/kWh in 2023-24) does not imply positive system-wide average (still negative at Rs 0.45/unit) because non-exchange winter imports at peak-hour rates are excluded from IEX data.
- Reconciliation noise: The three NEA totals for FY 2024/25 differ by ~30 GWh (imports) and ~48 GWh (exports). These are material for precision modeling but minor for directional analysis.
- Daily data incomplete: The parsed daily subset is <7% of the known archive depth. Early-month daily patterns are not yet available.
Bangladesh Trade Detail
See Nepal–Bangladesh Electricity Trade Route.