Q-Design Discharge
- Page status
- Verified core
- Updated
- 2026-11-04
- Last reviewed
- 2026-11-04
- Review due
- 2027-02-04
Summary
Q-design discharge is the regulatory parameter that determines a hydropower project's installed capacity and its Power Purchase Agreement contracted energy obligation. Nepal's Department of Electricity Development mandates Q45 exceedance for licensing — the flow rate exceeded 45% of the time — which sets both turbine size and the annual generation promise.
Simple Explanation
When a developer proposes a hydro plant, regulators require them to pick a river flow rate that the river will exceed for a certain percentage of days. That flow rate determines how big the turbines are and how much electricity the developer promises to produce. If the flow estimate is too optimistic, the plant cannot physically meet its promise — and the developer may default on loans.
Common Misunderstandings
- "Q-design is just a technical detail." It is not. It is the regulatory parameter that mechanically links hydrology assumptions to financial viability.
- "Higher Q-design always means a better project." Higher Q-design (e.g., Q40 vs Q65) means larger turbines and higher contracted energy — but also higher risk of underperformance if the river does not deliver.
- "Q-design failure is always the developer's fault." The WECS/DHM 1990 methodology used for ungauged rivers assumes hydrological stationarity that climate change has invalidated. Some "failures" are methodological, not fraudulent.
Q-design discharge is the regulatory parameter that mechanically determines a hydropower project's installed capacity and its Power Purchase Agreement (PPA) contracted energy obligation. A design discharge set too high — based on optimistic or outdated hydrology — inflates both the turbine size and the annual generation promise, locking the developer into performance targets that the river cannot sustain.
What Q_x means
In hydrology, Q_x denotes the flow rate (m³/s) that is exceeded X% of the time in the historical record. Q40 is the flow equaled or exceeded 40% of days; Q65 is exceeded 65% of days. Higher-percentile values (Q65, Q70) represent higher-flow points on the flow-duration curve — and therefore produce larger turbine sizing and higher contracted energy commitments.
The DoED licensing rule
Nepal's Department of Electricity Development (DoED) mandates through its licensing directive — "विद्युत आयोजनाको अनुमतिपत्र सम्बन्धी निर्देशिका, २०७५" (Directive on Licensing of Electricity Projects, 2075 BS), issued Kartik 7, 2075 (October 2018) — that new hydropower projects size their design discharge on Q45 exceedance ("Probability of Accident Q45 of Hydrological Time Series Data"). Earlier practices often used Q40 or even Q25, which tend to overstate dependable flow. Projects ≤1 MW for rural electrification are exempt: they may use Q80. The Q45 clause has not been amended since issuance.
The DoED initially charges licence fees on the basis of Q45 but has allowed Q40 if a PPA is ultimately signed. The government has deliberated removing the rigid Q-design cap entirely to allow site-specific optimization and reduce monsoon spillage risk.
How Q-design determines contracted energy
The chosen Q_design flows through a deterministic chain:
Installed capacity (MW): P = ρ × g × H_net × Q_design × η, where ρ is water density, g is gravity, H_net is net head after losses, and η is turbine-generator efficiency. A higher Q_design yields a larger turbine.
Contracted energy (GWh/year): Modeled by routing Q_design through the historical 12-month hydrograph. In months where river flow meets or exceeds Q_design, the plant is assumed to generate at 100% rated capacity. In dry months, output drops proportionally to available flow. The sum of monthly yields minus auxiliary consumption and transmission losses (typically 5–8%) equals the contracted energy written into the PPA.
Plant load factor: Implicit in the PPA is an assumed capacity utilization rate. If Q45 is used and equaled 45% of the time, the maximum expected load factor is approximately 45%. Actual PLF is further reduced by downtime, sediment flushing, and maintenance.
In other words: the PPA promises the river will deliver what the Q-design parameter assumes. If that assumption is wrong — because the data is old, the model is optimistic, or the climate has changed — the project is structurally incapable of meeting its contracted obligation.
The WECS/DHM 1990 methodology
For Nepal's vast number of projects on ungauged tributaries, the regulatory compliance apparatus relies on the WECS/DHM Method, officially formulated in 1990 — "Methodology for Estimating Hydrological Characteristics of Ungauged Locations in Nepal" (WECS/DHM, 1990, Seq. No. 331, Ministry of Water Resources). This methodology uses empirical regionalization equations derived from DHM gauging data collected up to 1985. DHM issued a partial update — "Hydrological Estimation in Nepal" (June 2016) — but the 1990 methodology remains the regulatory default for most feasibility studies.
The equations are simplistic: for example, instantaneous flood flows for a 2-year return period are calculated using a regression equation based solely on the catchment area below 3,000 meters in elevation.
Data processing, gap-filling, and database management within DHM and associated consulting firms have historically relied on HYMOS (version 4), a proprietary hydrological software system introduced to the region decades ago.
The continued application of this 36-year-old methodology is a critical systemic vulnerability. These empirical models rely entirely on the assumption of hydrological stationarity — the belief that the statistical properties of river flows remain constant over time. They fail to capture the acceleration of cryospheric melt, shifting monsoon precipitation patterns, and the increasing volatility of baseflows in the 21st century.
Despite the existence of a draft "Guideline for Climate Resilient Hydropower" (ICIMOD), DoED has not formally mandated any climate-adjusted hydrological decrement factor in feasibility studies. Projects licensed today are legally permitted to submit historical gauge data and apply 1990 empirical models, producing Q-design parameters that systematically overstate future dry-season reliable flows.
Generation performance: what projects actually deliver
The following table compares contracted energy against actual generation for projects where data is available. The sample is incomplete — Nepal has 215+ operational projects and no central public database tracks per-project generation vs contract.
| Project | Capacity (MW) | Q-design | Contracted (GWh/yr) | Actual (GWh/yr) | % of Contracted | Year | Source |
|---|---|---|---|---|---|---|---|
| Chilime | 22.1 | ~Q65 | 132.9 | 146.3 | 110.1% | FY 2076/77 | CHCL annual report |
| Chilime | 22.1 | ~Q65 | 132.9 | 153.7 | 115.6% | FY 2075/76 | CHCL annual report |
| Upper Tamakoshi | 456 | Q40–Q45 | 2,281 | 1,945.83 | 85.3% | FY 2079/80 | UKHLL audited accounts |
| Upper Tamakoshi | 456 | Q40–Q45 | 2,281 | 2,058.36 | 90.2% | FY 2080/81 | UKHLL audited accounts |
| Sanima Mai | 22.0 | Q40 | 121.7 | 116.8 | 96.0% | FY 2076/77 | CARE Ratings |
| Sanima Mai | 22.0 | Q40 | 121.7 | 107.1 | 88.0% | FY 2077/78 | CARE Ratings |
| Sanima Mai | 22.0 | Q40 | 121.7 | 88.8 | 73.0% | FY 2078/79 | CARE Ratings |
| Sanima Mai | 22.0 | Q40 | 121.7 | 103.4 | 85.0% | FY 2079/80 | CARE Ratings |
| Api Power (Upper Naugarh Gad) | 8.0 | Q40 | 46.0 | 31.2 | 68.0% | FY 2075/76 | ICRANP rating |
| Likhu-2 | 55 | RoR | 242.4 | ~146 | ~60% ⚠ | FY 2023/24 | CARE Nepal — exclude: stranded generation (NEA substation bottleneck), not a hydrology signal |
| Likhu-2 | 55 | RoR | 242.4 | ~221 | ~91% | FY 2024/25 | CARE Nepal — operationally valid baseline after 200 MVA transformer upgrade |
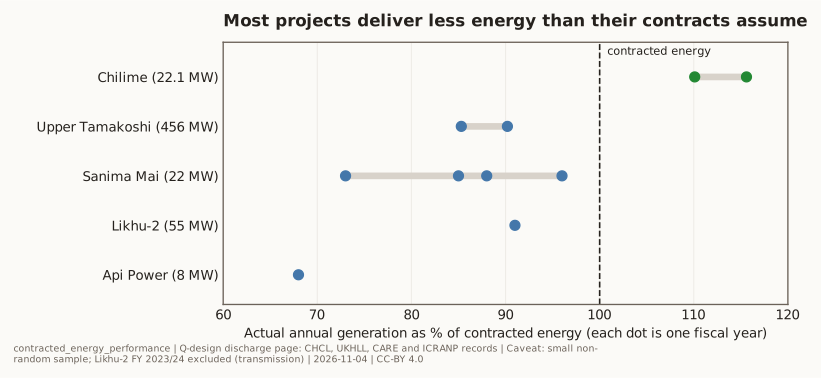
A broader audit published by Urja Khabar (January 2026, Kumar Pandey), citing a MoEWRI report from Ashad 2077 (mid-2020) on financially distressed small hydropower projects, found that 13 projects produced less than 50% of contracted energy, 40 produced less than 70%, and 50 hovered around 80%. Strikingly, zero projects evaluated in that dataset exceeded 80% of design energy — except for Chilime. The Urja Khabar article is secondary reporting of the MoEWRI assessment, not an independent data audit; no project-level dataset accompanies the publication.
The claim that "the average small project produces only ~32% of its contracted energy" circulates in industry discussion. This figure does not appear in the Urja Khabar/MoEWRI source at all — a full-text review of the Kumar Pandey (January 2026) article confirms that the only ~33% figure in the publication refers to administrative and operational costs consuming approximately 33% of revenue for affected projects, not to generation output. The 32% generation figure likely represents a dry-season performance claim circulating independently in industry commentary, not an annual average. If the sector-wide annual average were strictly 32%, the Nepalese banking system's hydro exposure would have triggered a systemic financial collapse. Annual averages for underperforming projects tend to float between 60% and 80%. The 32% figure is best understood as performance during the most critical dry-season months, when energy is most valuable and most heavily penalized.
The Chilime anomaly: why it overperforms and why it is not replicable
Chilime Hydropower (22.1 MW, commissioned 2003) consistently generates above its contracted energy — 110–115% in recent fiscal years. This makes it the sector's most-cited success case. But Chilime's performance is a product of a different era and is structurally non-replicable:
- Conservative Q-design: Chilime was likely designed on Q65 or higher — a more cautious flow percentile than the Q40–Q45 now permitted. This means its contracted energy was set conservatively low relative to actual hydrology.
- Snow-fed basin: Chilime operates on a highly reliable snow-fed river system with less seasonal volatility than monsoon-dominated RoR projects on ungauged tributaries.
- Pre-climate-shift commissioning: Chilime entered operation before the acceleration of cryospheric melt and shifting monsoon patterns that now undermine the stationarity assumption.
- No modern leverage stress: Built in an era of lower construction costs and lower debt leverage, Chilime's financial model was never subjected to the DSCR pressures facing post-2015 projects.
- NEA subsidiary status: Chilime is an NEA subsidiary with a dual-tier billing architecture (Regular/Excess classification) yielding a blended rate of NPR 7.57/kWh — a 37.1% revenue advantage over the standard private IPP blended rate of NPR 5.52/kWh. This is not a headline-tariff gap but a billing-architecture subsidy, documented in Chilime and NEA Triple-Authority Conflict.
Chilime's 2010 IPO occurred after seven years of profitable operations, enabling it to distribute a 35% cash dividend within a year of listing. Modern IPOs float pre-revenue. See IPO Hydropower Bailout.
Beyond the anomaly — the performance spectrum
Chilime's overperformance is not unique; it shares a structural pattern with other conservative-design, glacier-fed plants. Madhya Marsyangdi (70 MW, Tilicho-fed) achieves 107.6% of design — the highest in the NEA fleet. Khimti-I (60 MW, Nepal's first private IPP, 1996 USD PPA) averages 103% of contracted energy over 25 years. Both are larger-scale cases of the same mechanism: accurate or conservative hydrology in relatively stable catchments produces generation above contracted levels.
The opposite end of the spectrum — severe underperformance — includes the NEA fleet as well as private IPPs. Upper Trishuli 3A (60 MW, 72.7% of design) and Trishuli (24 MW, 60% of design, 58 years old) demonstrate that public ownership does not guarantee design-energy delivery. And the Likhu-2 case is a categorical warning: Likhu -2's 60% PLF in FY 2023/24 appears in the performance table as underperformance but was caused by a grid evacuation bottleneck at the NEA New Khimti substation, not hydrology — a reminder that some "Q-design failure" signals in generation data are actually Buildability signals masquerading as hydrology.
The DSCR break-point
Nepal Rastra Bank (NRB) requires a minimum Debt Service Coverage Ratio (DSCR) of 1.3x for hydro project financing, though competitive syndicates and multilateral lenders (ADB, IFC) may accept 1.2x.
Using standard parameters for a representative 10 MW RoR project — $2M/MW capex, 70:30 debt-equity, 11% interest, 15-year tenor, 20% fixed OpEx — calibrated to yield DSCR 1.25x at 100% of contracted energy:
| Generation (% of contracted) | Revenue | CFADS | DSCR | Status |
|---|---|---|---|---|
| 100% | $3,041,875 | $2,433,500 | 1.25x | Healthy |
| 80% | $2,433,500 | $1,825,125 | 0.94x | Technical default |
| 65% | $1,977,219 | $1,368,844 | 0.70x | Covenant breach |
| 32% | $973,400 | $364,800 | 0.19x | Immediate default |
The typical Nepalese IPP financial model falls below the critical 1.0x DSCR threshold if actual generation drops below approximately 82–84% of its contracted energy target. Given that zero of the 50+ small projects evaluated in the Urja Khabar audit exceeded 80% generation, a large portion of the IPP sector is likely operating in technical default on original loan covenants.
NRB forbearance
Despite widespread DSCR breaches, formal declarations of bankruptcy or forced liquidations remain rare. NRB classifies Non-Performing Loans (NPLs) rigorously — overall banking sector NPLs have risen to 4.4–5.4%, with hydro-sector stress a known contributor. However, banks frequently restructure hydropower loans (extending tenors, lowering rates, capitalizing unpaid interest) rather than recognizing NPL status. This is implicitly permitted under NRB guidelines to prevent systemic collapse of the energy sector.
The "watch list" category and "restructured/rescheduled loans" have surged — watch list loans increased by 66.59% in a single year.
The appraisal industry feedback loop
Because project finance models require robust generation data to pass the DSCR 1.2–1.3x threshold demanded by lenders, and because DoED rules permit the use of unadjusted historical data or 1990 WECS/DHM formulas for ungauged rivers, consultants are structurally incentivized to produce optimistic Flow Duration Curves. A concentrated pool of domestic engineering consultancies dominates feasibility studies across the sector. While there is no public evidence of deliberate falsification, the systemic incentive is clear: generate numbers that make the project appear bankable, using regulatory-approved methods that assume a stationary climate. This institutionalizes the production of stranded assets.
Regulatory accountability
The DoED Director-General and the Survey and Feasibility Study Section within the Project Study Division are responsible for approving hydrological assessments. The Water and Energy Commission Secretariat (WECS) holds a theoretical mandate for basin-wide resource clearance but has historically suffered from weak inter-ministerial coordination, allowing DoED to license projects sequentially on the same river without cumulative hydrological impact modeling.
The Auditor General has not retroactively penalized DoED for licensing projects based on flawed hydrological models, though recent climate-responsive public financial management audit directives signal emerging scrutiny.
Related
- Peak Water — the glacio-hydrological window that Q-design assumptions ignore
- Seasonal Mismatch — the structural monsoon surplus vs winter deficit
- Buildability — execution risk amplifies when contracted energy is unrealistic
- NEA Triple-Authority Conflict — the same institution (NEA) that enforces PPA contracted energy also controls dispatch and penalties
- IPO Hydropower Bailout — investors in IPOs are not told that contracted energy targets may be structurally unachievable
What would change our mind
- A public, project-by-project database of contracted versus actual generation showing that most projects meet their contracted energy in normal hydrological years.
- Evidence that the DoED licensing rule and appraisal practice now use recent, climate-adjusted flow records, so new contracts no longer embed optimistic design discharge.
- Dry-season performance data showing shortfalls are driven mainly by outages and transmission rather than by design hydrology.
Update history
| Date | Change |
|---|---|
| 2026-11-04 | Added the contracted-energy exhibit, conditions for revision and this history; renamed related links |
| 2026-05-02 | Generation-performance table, Chilime anomaly and financial consequences |